แผนที่ความหนาแน่น
จัดทุกอย่างให้เป็นระเบียบอยู่เสมอด้วยคอลเล็กชัน
บันทึกและจัดหมวดหมู่เนื้อหาตามค่ากำหนดของคุณ
ปลายทาง
heatmapTiles
จะแสดงฮีตแมปที่เกี่ยวข้องกับคุณภาพอากาศผ่านการวางซ้อนไทล์ การวางซ้อน
ไทล์คือชุดของไทล์รูปภาพ PNG ที่แสดงบน
Google Maps ได้ ไทล์รูปภาพแต่ละรายการมีขนาด (256 x 256 พิกเซล)
เกี่ยวกับไทล์แผนที่ความหนาแน่น
การวางซ้อนของชิ้นส่วนแผนที่เป็นตารางกริดที่ประกอบขึ้นจากคอลเล็กชันของชิ้นส่วนแผนที่
แต่ละชิ้นมีพิกัด (X
,Y
) กำหนดไว้
ไทล์ที่มีพิกัด (0,0) จะอยู่ที่มุมตะวันตกเฉียงเหนือของแผนที่เสมอ
ค่า X
จะเพิ่มขึ้นจากตะวันตกไปตะวันออก
ส่วนค่า Y
จะเพิ่มขึ้นจากเหนือไปใต้
zoom level
จะกำหนดว่าเนื้อหาของแผนที่จะปรากฏในมุมมองแผนที่
มีขนาดใหญ่หรือเล็กเพียงใด ขนาดตารางกริดของไทล์จะกำหนดโดยการปรับขนาดพิกัด X
และ Y
แบบยกกำลังตามระดับการซูม
gridSizeX = XzoomLevel
gridSizeY = YzoomLevel
ตัวอย่างเช่น ที่ระดับการซูม 2 แผนที่โลกจะแสดงโดยใช้เมทริกซ์ 4 x 4
ซึ่งมีไทล์ทั้งหมด 16 รายการ นอกจากนี้ การซูมยังกำหนดค่าสูงสุด
ที่อนุญาตสำหรับพิกัดด้วย
รูปภาพต่อไปนี้แสดงฮีตแมป US_AQI
ที่มีระดับการซูม 2
พร้อมกับพิกัดของแต่ละไทล์

ดูรายละเอียดเพิ่มเติมได้ที่พิกัดแผนที่และไทล์
เกี่ยวกับปลายทางแผนที่ความหนาแน่น
ไทล์แผนที่ความหนาแน่นแสดงด้วยอาร์เรย์ไบต์ที่มีข้อมูลไทล์เป็นรูปภาพ PNG
คุณขอไทล์ฮีตแมปคุณภาพอากาศปัจจุบันได้โดยใช้ปลายทาง
heatmapTiles
ด้วยการส่งคำขอ HTTP GET ไปยัง
https://airquality.googleapis.com/v1/mapTypes/TYPE/heatmapTiles/Z/X/Y?key=YOUR_API_KEY
ต้องระบุพารามิเตอร์คำขอทั้งหมดในคำขอ
TYPE
- แผนที่ความร้อนประเภทที่จะแสดงผล ดูค่าที่อนุญาต
Z
- ระดับการซูมที่กำหนดขนาดของเนื้อหาในแผนที่
ซึ่งปรากฏในมุมมองแผนที่ ค่าที่ใช้ได้คือ 0-16 โดยค่า 0 จะแสดงทั้งโลกในไทล์เดียว
X
,Y
- พิกัดของไทล์ที่จะดึงข้อมูล โดยอิงจากมุมบนซ้าย (0,0) ค่า X
จะเพิ่มขึ้นจากตะวันตกไปตะวันออก และค่า Y
จะเพิ่มขึ้นจากเหนือไปใต้
พิกัดไทล์ต้องถูกต้องสำหรับระดับการซูมที่ระบุ
เช่น หากคุณตั้งค่าระดับการซูมเป็น 2 และขอไทล์ที่พิกัด 10,10 API จะแสดงข้อผิดพลาด
YOUR_API_KEY
- คีย์ API ของแอปพลิเคชัน คีย์นี้จะระบุตัวตน
แอปพลิเคชันของคุณเพื่อวัตถุประสงค์ในการจัดการโควต้า ดูข้อมูลเพิ่มเติมได้ที่รับ
คีย์
ตัวอย่างคำขอแผนที่ความหนาแน่น
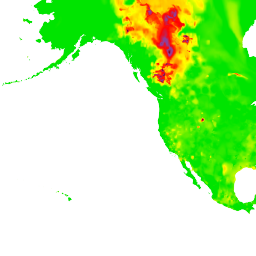
รูปภาพด้านบนแสดงUS_AQI
ฮีตแมปที่มีระดับการซูม 2
พร้อมกับพิกัดของไทล์แต่ละรายการ ตัวอย่างต่อไปนี้ใช้heatmapTiles
ปลายทางเพื่อขอไทล์ที่พิกัด 0,1 จากฮีตแมป
https://airquality.googleapis.com/v1/mapTypes/US_AQI/heatmapTiles/2/0/1?key=YOUR_API_KEY
โดยไทล์จะปรากฏดังนี้

ดูข้อมูลเพิ่มเติมเกี่ยวกับการวางซ้อนไทล์บนแผนที่เริ่มต้นได้ที่
ประเภทแผนที่ซ้อนทับ
เนื้อหาของหน้าเว็บนี้ได้รับอนุญาตภายใต้ใบอนุญาตที่ต้องระบุที่มาของครีเอทีฟคอมมอนส์ 4.0 และตัวอย่างโค้ดได้รับอนุญาตภายใต้ใบอนุญาต Apache 2.0 เว้นแต่จะระบุไว้เป็นอย่างอื่น โปรดดูรายละเอียดที่นโยบายเว็บไซต์ Google Developers Java เป็นเครื่องหมายการค้าจดทะเบียนของ Oracle และ/หรือบริษัทในเครือ
อัปเดตล่าสุด 2025-08-31 UTC
[null,null,["อัปเดตล่าสุด 2025-08-31 UTC"],[[["\u003cp\u003eThe \u003ccode\u003eheatmapTiles\u003c/code\u003e endpoint delivers air quality heatmaps as a tile overlay, which is a collection of PNG images displayed on top of a Google Map.\u003c/p\u003e\n"],["\u003cp\u003eEach tile within the overlay has specific (X, Y) coordinates, with (0,0) at the northwest corner and increasing values eastward (X) and southward (Y), determined by the zoom level.\u003c/p\u003e\n"],["\u003cp\u003eThe zoom level (0-16) controls the map's scale and the tile grid size, with higher zoom levels showing more detailed areas.\u003c/p\u003e\n"],["\u003cp\u003eTo request a heatmap tile, you need to provide the heatmap type, zoom level (Z), tile coordinates (X, Y), and your API key in the request URL.\u003c/p\u003e\n"],["\u003cp\u003eYou can overlay these heatmap tiles on top of the default map using methods described in the provided documentation for a comprehensive air quality visualization.\u003c/p\u003e\n"]]],[],null,["The\n[`heatmapTiles`](/maps/documentation/air-quality/reference/rest/v1/mapTypes.heatmapTiles/lookupHeatmapTile)\nendpoint provides air quality related heatmaps through a tile overlay. A tile\noverlay is a collection of PNG image tiles that can be displayed on top of a\nGoogle Maps. Each image tile is (256 x 256 pixels).\n\nAbout heatmap tiles\n\nThe tile overlay is a grid assembled from a collection of tiles,\neach assigned (`X`,`Y`) coordinates.\nThe tile with coordinates (0,0) is always at the northwest corner\nof the map. The `X` values increase from west to east,\nwhile the `Y` values increase from north to south.\n\nThe `zoom level` determines how large or small the contents of a map appear in a\nmap view. The tile grid size is determined by scaling the `X` and `Y`\ncoordinates exponentially by the zoom level. \n\n```text\ngridSizeX = XzoomLevel\ngridSizeY = YzoomLevel\n```\n\nFor example, at a zoom level of 2, the world map is represented using a 4 x 4\nmatrix, for a total of 16 tiles. The zoom also determines what is the max value\nallowed for the coordinates.\n\nThe following image shows a `US_AQI` heatmap with a zoom level of 2,\nalong with the coordinates of each tile:\n\nSee [Map and Tile coordinates](/maps/documentation/javascript/coordinates)\nfor additional details.\n\nAbout the heatmap endpoint\n\nA heatmap tile is represented by a bytes array containing the tile data as a PNG\nimage. You request current air quality heatmap tiles using the\n[`heatmapTiles`](/maps/documentation/air-quality/reference/rest/v1/mapTypes.heatmapTiles/lookupHeatmapTile)\nendpoint by sending an HTTP GET request to: \n\n```html\nhttps://airquality.googleapis.com/v1/mapTypes/TYPE/heatmapTiles/Z/X/Y?key=YOUR_API_KEY\n```\n\nAll request parameters are required in a request:\n\n- `TYPE` - The type heatmap to return. See [allowed\n values](/maps/documentation/air-quality/reference/rest/v1/mapTypes.heatmapTiles/lookupHeatmapTile#maptype).\n\n- `Z` - Zoom level that determines how large or small the contents of a map\n appear in a map view. Allowed values are 0-16, where a value of 0 displays\n the entire world in a single tile.\n\n- `X`,`Y` - The coordinates of the tile to retrieve, relative to the north\n west corner (0,0). `X` values are increasing from west to east and `Y`\n values are increasing from north to south.\n\n Tile coordinates have to be valid for the specified zoom level.\n For example, if you set the zoom level to 2, and request a tile at\n coordinates of 10,10, the API returns an error.\n- `YOUR_API_KEY` - Your application's API key. This key identifies your\n application for purposes of quota management. For more information, see [get\n a key](/maps/documentation/air-quality/get-api-key).\n\nExample heatmap request\n\nThe image above shows a `US_AQI` heatmap with a zoom level of 2,\nalong with the coordinates of each tile. The following example uses the\n`heatmapTiles` endpoint to request the tile at coordinates 0,1 from the\nheatmap: \n\n```html\nhttps://airquality.googleapis.com/v1/mapTypes/US_AQI/heatmapTiles/2/0/1?key=YOUR_API_KEY\n```\n\nThe tile appears as:\n\nFor more information on overlaying tiles on top of the default map, see\n[Overlay Map Types](/maps/documentation/javascript/examples/maptype-overlay)."]]