
heatmapTiles
エンドポイントは、タイル オーバーレイを通じて大気質関連のヒートマップを提供します。タイル
オーバーレイは、Google マップの上に表示できる PNG 画像タイルのコレクションです。各画像タイルは(256 x 256
ピクセル)です。
ヒートマップ タイルについて
タイル オーバーレイは、タイルのコレクションから組み立てられたグリッドで、それぞれに(X、Y)座標が割り当てられています。
座標(0,0)のタイルは常にマップの北西隅にあります。X
値は西から東へと増分し、Y 値は北から南へと増分します。
zoom level によって、地図の内容が
地図ビューに表示される大きさや小ささが決まります。タイルグリッドのサイズは、X 座標と Y
座標をズームレベルで指数関数的にスケーリングすることで決まります。
gridSizeX = XzoomLevel
gridSizeY = YzoomLevel
たとえば、ズームレベル 2 では、世界地図は 4 x 4 の行列で表され、合計 16 個のタイルになります。ズームによって、座標に許容される最大値も決まります。
次の画像は、ズームレベルが 2 の US_AQI ヒートマップと、各タイルの座標を示しています。

詳細については、地図とタイル座標 をご覧ください。
ヒートマップ エンドポイントについて
ヒートマップ タイルは、タイルデータを PNG 画像として含むバイト配列で表されます。現在の大気質ヒートマップ タイルをリクエストするには、
heatmapTiles
エンドポイントを使用して、次の URL に HTTP GET リクエストを送信します。
https://airquality.googleapis.com/v1/mapTypes/TYPE/heatmapTiles/Z/X/Y?key=YOUR_API_KEY
リクエストでは、すべてのリクエスト パラメータが必要です。
TYPE- 返すヒートマップのタイプ。許容値をご覧ください。Z- 地図の内容が地図ビューに表示される大きさや小ささを決定するズームレベル 。許容値は 0 ~ 16 です。値が 0 の場合は、全世界が 1 つのタイルに表示されます。X、Y\- 北西隅(0,0)を基準とした、取得するタイルの座標。X値は西から東へと増分し、Y値は北から南へと増分します。タイル座標は、指定したズームレベルで有効である必要があります。 たとえば、ズームレベルを 2 に設定し、座標 10,10 のタイルをリクエストすると、API はエラーを返します。
YOUR_API_KEY- アプリケーションの API キー。このキーは、割り当て管理の目的でアプリケーションを識別します。詳細については、get a keyをご覧ください。
ヒートマップ リクエストの例
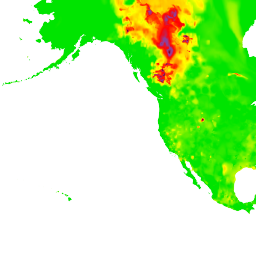
上の画像は、ズームレベルが 2 の US_AQI ヒートマップと、各タイルの座標を示しています。次の例では、heatmapTiles
エンドポイントを使用して、ヒートマップから座標 0,1 のタイルをリクエストします。
https://airquality.googleapis.com/v1/mapTypes/US_AQI/heatmapTiles/2/0/1?key=YOUR_API_KEY
タイルは次のように表示されます。
デフォルトの地図の上にタイルを重ねる方法について詳しくは、 地図タイプのオーバーレイをご覧ください。