
借助数据集的数据驱动型样式,您可以上传自己的地理空间数据集,将自定义样式应用于数据地图项,以及在地图上显示这些数据地图项。此外,您还可以根据点、多段线和多边形几何图形创建数据可视化内容,并使数据地图项响应点击事件。仅矢量地图支持数据集的数据驱动型样式(必须提供地图 ID)。
添加自定义地理空间数据集
使用 Google Cloud 控制台或 Google Cloud Shell 添加自定义数据。每个数据集的 ID 都是唯一的,可用于将数据集与地图样式相关联。下面列出了支持的数据格式:
- GeoJSON
- 以英文逗号分隔 (CSV)
- KML
如需详细了解与数据集相关的要求和限制,请参阅创建和管理数据集
关于公共数据集
如需设置数据集的样式,您必须将地图样式与地图 ID 相关联,这样也会将数据集与地图 ID 相关联。在应用中,开发者可以引用该地图 ID 以及与之关联的任何地图样式和地理空间数据。不会对地理空间数据应用任何额外的访问权限控制,因此任何拥有该应用的用户都可以有效访问地理空间数据。
设置数据地图项的样式
上传自定义数据并将其与地图样式和地图 ID 相关联后,便可以设置数据地图项的样式,使其产生视觉效果,并使地图项响应点击事件。
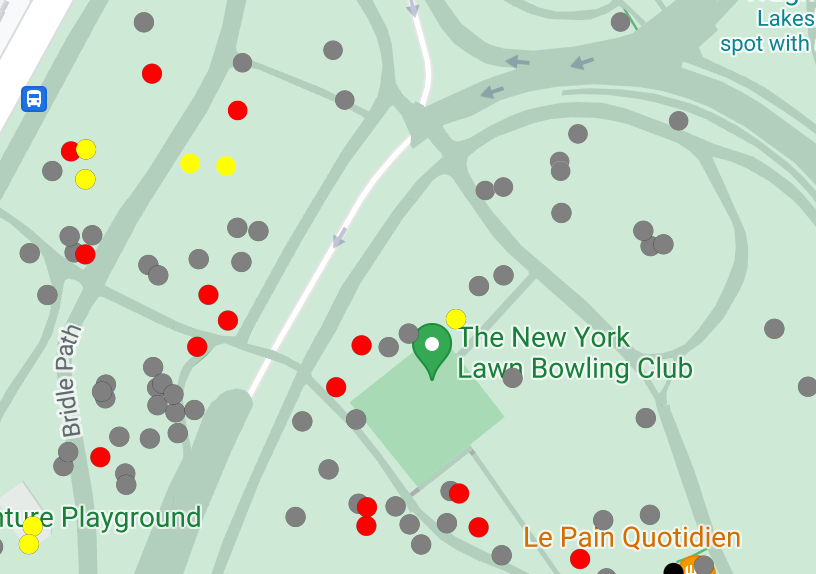
设置点数据的样式以在地图上显示特定位置。
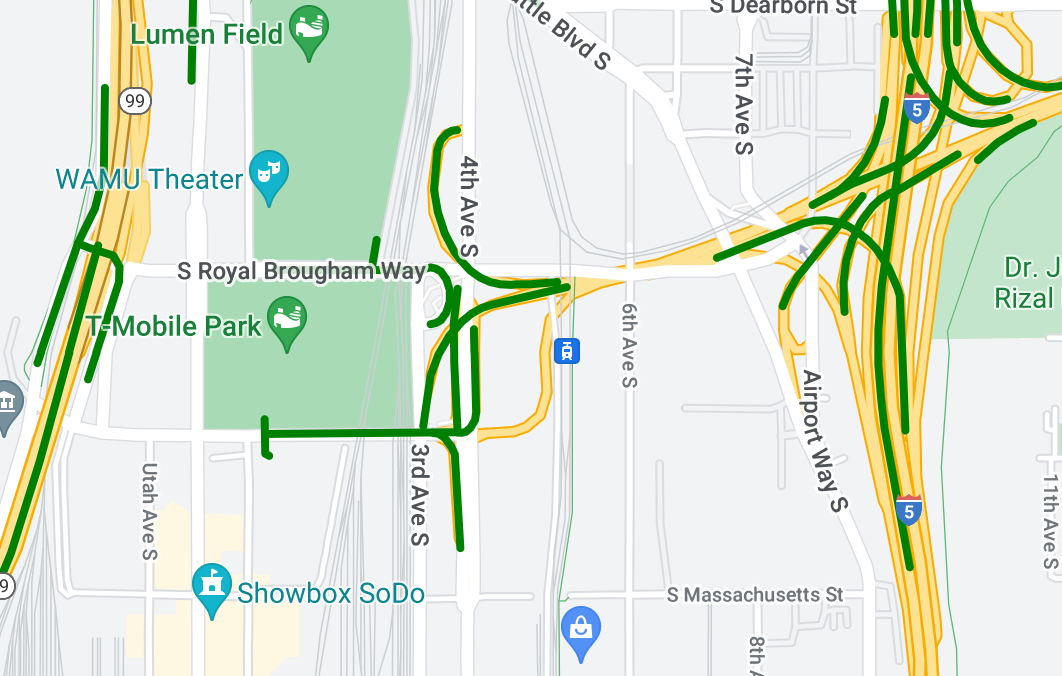
设置多段线数据的样式以突出地貌。
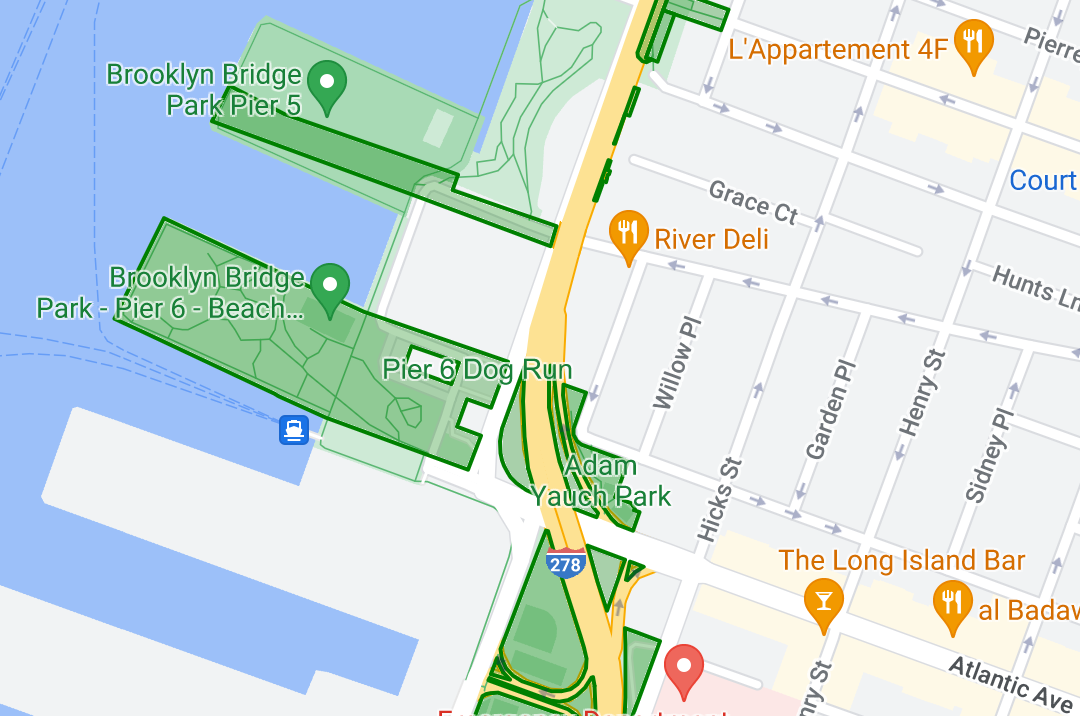
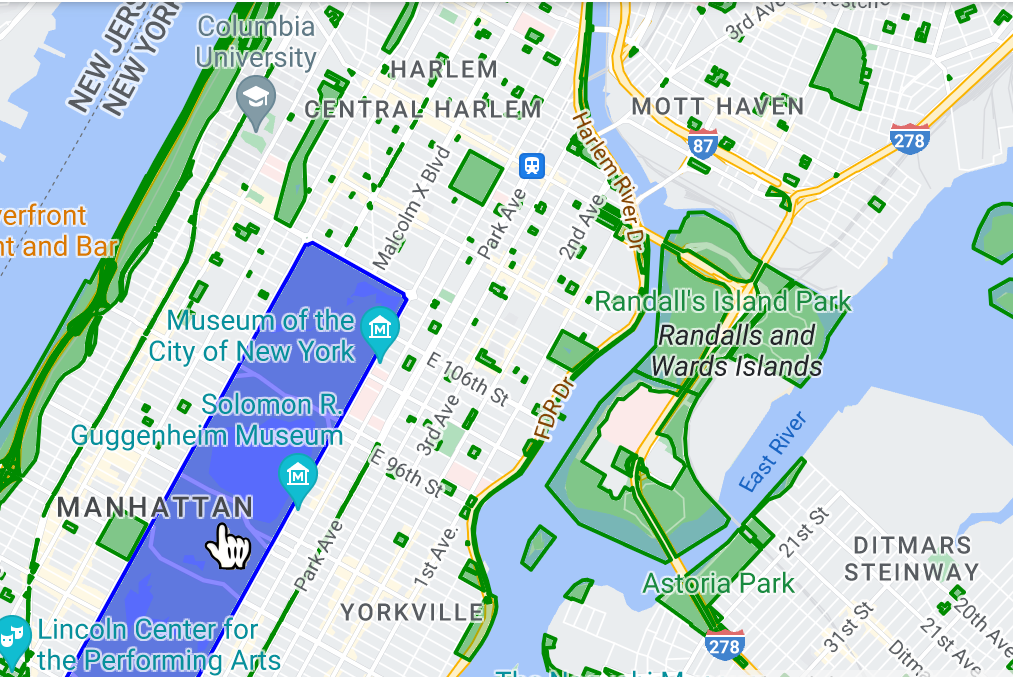
设置多边形数据的样式以突出地理区域。
通过添加事件监听器使数据地图项响应点击事件。
渲染大量数据要素时的性能
在渲染大量数据要素时,您可能会发现应用存在性能问题。例如,在缩放或旋转时,您可能会发现应用存在性能滞后或稳定性问题。