BigQuery でログを分析する
コレクションでコンテンツを整理
必要に応じて、コンテンツの保存と分類を行います。
BigQuery は、分析を実行するための強力なツールです。これを使用して、長期的なログを保存し、データに対して SQL のようなクエリを実行できます。分析に BigQuery を使用するには、次のセクションで説明するように、ログを BigQuery に明示的にルーティングする必要があります。
BigQuery にログを転送する
- ログ エクスプローラで、Fleet Engine ログを分離するフィルタ
Fleetengine.googleapis.com/Fleet
を作成します。
- [クエリ結果] ペインで、[アクション] メニューまたは [その他の操作] メニューをクリックし、[シンクを作成] を選択します。
- シンク名を指定します(例: FleetEngineLogsSink)。[次へ] をクリックします。
- [シンクの宛先] で [BigQuery データセット] を選択します。
- [BigQuery データセットを選択] で [新しい BigQuery データセットを作成する] を選択します。
- [データセットを作成] ダイアログで、データセット ID を入力します。
- その他の設定はそのままにして、[データセットを作成] をクリックします。
- [パーティション分割テーブルを使用する] をオンにします。[次へ] をクリックします。
- [シンクに含めるログの選択] と [シンクに含めないログの選択] はそのままにします。
- [シンクを作成] をクリックします。
ログが BigQuery データセットに登録され始めます。これにはしばらく時間がかかることがあります。サポートされている宛先にログを転送するもご覧ください。
ログデータを BigQuery にルーティングすると、FleetEngineLogs データセットの下にある複数のテーブルが自動的に入力されます。ログタイプごとに 1 つのテーブルが入力されます。
- CreateVehicle
- GetVehicle
- ListVehicles
- SearchVehicles
- UpdateVehicle
- CreateTrip
- GetTrip
- UpdateTrip
- ListTrips
テーブル名には次のパターンが使用されます。
project_id.data_set.log_name
たとえば、プロジェクトの名前が test-project で、データセット名が FleetEngineLogs の場合、CreateTrip
テーブルの名前は次のようになります。
test-project.FleetEngineLogs.fleetengine_googleapis_com_create_trip
BigQuery のクエリ例
次のサンプルクエリは、BigQuery でさまざまなログエントリを検索する方法を示しています。
CreateTrips ログの数(時間ごとにグループ化)
SELECT TIMESTAMP_TRUNC(timestamp, HOUR) as hour,
count(*) as num_trips_created
FROM
`ProjectId.FleetEngineLogs.fleetengine_googleapis_com_create_trip`
GROUP BY hour
ORDER by hour
車両 1 台あたりの 1 時間あたりの停車回数
SELECT
jsonpayload_v1_updatevehiclelog.request.vehicleid AS vehicle,
TIMESTAMP_TRUNC(timestamp, HOUR) AS hour,
COUNT(*) AS num_stops
FROM
`ProjectId.FleetEngineLogs.fleetengine_googleapis_com_update__vehicle`
WHERE
ARRAY_LENGTH(jsonpayload_v1_updatevehiclelog.request.vehicle.remainingvehiclejourneysegments) > 0
AND jsonpayload_v1_updatevehiclelog.request.vehicle.remainingvehiclejourneysegments[
OFFSET
(0)].stop.state = 'VEHICLE_STOP_STATE_LOG_ARRIVED'
GROUP BY
1,
2
ORDER BY
2
たとえば、このクエリでは、過去 1 時間に次のことがわかります。
- 車両 A は 12 時台に 10 回停車し、13 時台に 8 回停車しました。
- 車両 B は 11 時間目に 5 回、12 時間目に 7 回停車しました。
- 車両 C は 13 時間目に 12 か所、14 時間目に 9 か所の停留所に停車しました。
BigQuery に転送されたログを表示するもご覧ください。
BigQuery と Looker Studio を統合する
BigQuery は、ビジネス インテリジェンス ツールと統合して、ビジネス分析用のダッシュボードを作成できます。Looker Studio をご覧ください。
次の例は、地図上で乗車と車両の移動を可視化する Looker Studio ダッシュボードを構築する方法を示しています。
- 新しい Looker Studio ダッシュボードを起動し、データ接続として BigQuery を選択します。
- [カスタムクエリ] を選択し、課金対象の Cloud プロジェクトを手動で入力または選択します。
- クエリボックスに次のいずれかのクエリを入力します。
オンデマンド乗車クエリの例
SELECT
timestamp,
labels.vehicle_id,
jsonpayload_v1_updatevehiclelog.response.lastlocation.location.latitude AS lat,
jsonpayload_v1_updatevehiclelog.response.lastlocation.location.longitude AS lng
FROM
`ProjectId.TableName.fleetengine_googleapis_com_update_vehicle`
スケジュール済みタスクのクエリの例
SELECT
labels.delivery_vehicle_id,
jsonpayload_v1_updatedeliveryvehiclelog.response.lastlocation.rawlocation.longitude as lat, jsonpayload_v1_updatedeliveryvehiclelog.response.lastlocation.rawlocation.latitude as lng
FROM `ProjectID.TableName.fleetengine_googleapis_com_update_delivery_vehicle`
- [グラフの種類] で [バブルマップ] を選択し、[場所] フィールドを選択します。
- [フィールドを追加] を選択します。
- フィールドに名前を付け、数式
CONCAT(lat, ",", lng)
を追加します。
- タイプを [Geo->Latitude, Longitude] に設定します。
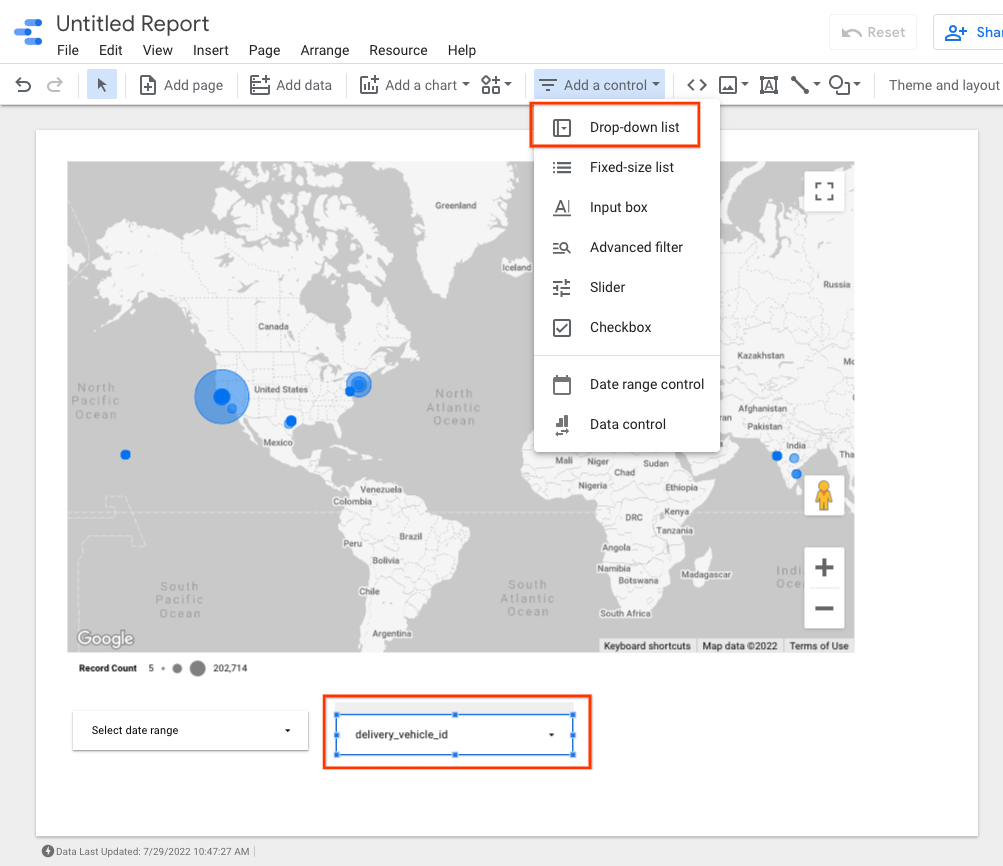
- ダッシュボードにコントロールを追加して、データをフィルタできます。たとえば、[期間] フィルタを選択します。
- [期間] ボックスを編集して、デフォルトの期間を選択します。
vehicle_id
のプルダウン リスト コントロールを追加できます。これらのコントロールを使用すると、車両の移動や、旅行中の移動を可視化できます。
Looker Studio の出力例:

次のステップ
データ保持ポリシーに準拠するには、ログの保持を制限するをご覧ください。
特に記載のない限り、このページのコンテンツはクリエイティブ・コモンズの表示 4.0 ライセンスにより使用許諾されます。コードサンプルは Apache 2.0 ライセンスにより使用許諾されます。詳しくは、Google Developers サイトのポリシーをご覧ください。Java は Oracle および関連会社の登録商標です。
最終更新日 2025-09-05 UTC。
[null,null,["最終更新日 2025-09-05 UTC。"],[[["\u003cp\u003eBigQuery enables analysis of Fleet Engine logs via SQL-like queries after routing logs to a BigQuery dataset.\u003c/p\u003e\n"],["\u003cp\u003eRouting logs to BigQuery involves creating a sink in the Logs Explorer and selecting a BigQuery dataset as the destination.\u003c/p\u003e\n"],["\u003cp\u003eBigQuery automatically populates tables for each Fleet Engine log type under the specified dataset.\u003c/p\u003e\n"],["\u003cp\u003eExample queries demonstrate how to analyze trip creation, vehicle stops, and other data points within BigQuery.\u003c/p\u003e\n"],["\u003cp\u003eBigQuery integrates with Looker Studio for creating dashboards and visualizing data, such as vehicle movement on a map.\u003c/p\u003e\n"]]],[],null,["BigQuery is a powerful tool for performing analytics. You can use it to store\nlonger-term logs and to perform SQL-like queries against the data. To use\nBigQuery for analysis, you must explicitly route your logs to BigQuery, as\ndescribed in the next section.\n\nRoute logs to BigQuery\n\n1. In the [Logs Explorer](https://cloud.google.com/logging/docs/view/logs-explorer-interface), create a filter that isolates the Fleet Engine logs: `Fleetengine.googleapis.com/Fleet`.\n2. In the **Query Results pane** , click the **Actions** or **More Actions** menu and choose **Create Sink**.\n3. Specify a sink name (for example, *FleetEngineLogsSink* ). Click **Next**.\n4. In the **Sink Destination** , select **BigQuery dataset**.\n5. In **Select BigQuery dataset** , select **Create new BigQuery dataset**.\n6. In the **Create dataset** dialog, enter a **Dataset ID**.\n7. Leave everything else as is and click **Create dataset**.\n8. Check **Use partitioned tables** . Click **Next**.\n9. Leave **Choose logs to include in sink** and **Choose logs to filter out of\n sink** as they are.\n10. Click **Create Sink**.\n\nYour logs should now begin to populate the BigQuery dataset, which can take a\nshort while. See also [Route logs to supported destinations](https://cloud.google.com/logging/docs/export/configure_export_v2).\n\nOnce you are routing log data to BigQuery, several tables under the\n*FleetEngineLogs* dataset are automatically populated, one for each log type:\n\n- CreateVehicle\n- GetVehicle\n- ListVehicles\n- SearchVehicles\n- UpdateVehicle\n- CreateTrip\n- GetTrip\n- UpdateTrip\n- ListTrips\n\nThe table names use the following pattern: \n\n project_id.data_set.log_name\n\nFor example, if the project is called *test-project* and the dataset name is\n*FleetEngineLogs* , the `CreateTrip` table has the following name: \n\n test-project.FleetEngineLogs.fleetengine_googleapis_com_create_trip\n\nExample queries for BigQuery\n\nThe following example queries show how you can search for different log entries\nin BigQuery.\n\nNumber of CreateTrips logs grouped by hour \n\n SELECT TIMESTAMP_TRUNC(timestamp, HOUR) as hour,\n count(*) as num_trips_created\n FROM\n `ProjectId.FleetEngineLogs.fleetengine_googleapis_com_create_trip`\n GROUP BY hour\n ORDER by hour\n\nNumber of stops per vehicle per hour \n\n SELECT\n jsonpayload_v1_updatevehiclelog.request.vehicleid AS vehicle,\n TIMESTAMP_TRUNC(timestamp, HOUR) AS hour,\n COUNT(*) AS num_stops\n FROM\n `ProjectId.FleetEngineLogs.fleetengine_googleapis_com_update__vehicle`\n WHERE\n ARRAY_LENGTH(jsonpayload_v1_updatevehiclelog.request.vehicle.remainingvehiclejourneysegments) \u003e 0\n AND jsonpayload_v1_updatevehiclelog.request.vehicle.remainingvehiclejourneysegments[\n OFFSET\n (0)].stop.state = 'VEHICLE_STOP_STATE_LOG_ARRIVED'\n GROUP BY\n 1,\n 2\n ORDER BY\n 2\n\nFor example, this query could tell you that in the last hour:\n\n- Vehicle A completed 10 stops in hour 12 and 8 stops in hour 13.\n- Vehicle B completed 5 stops in hour 11 and 7 stops in hour 12.\n- Vehicle C completed 12 stops in hour 13 and 9 stops in hour 14.\n\nSee also [View logs routed to BigQuery](https://cloud.google.com/logging/docs/export/bigquery).\n\nIntegrate BigQuery with Looker Studio\n\nBigQuery can be integrated with business intelligence tools to create dashboards\nfor business analytics. See [Looker Studio](https://lookerstudio.google.com).\n\nThe following example shows how to build a Looker Studio dashboard for\nvisualizing trips and vehicle movements on a map.\n\n1. Launch a new [Looker Studio](https://lookerstudio.google.com) dashboard and select **BigQuery** as the data connection.\n2. Select **Custom Query** and manually enter or select the Cloud Project to which it should be billed.\n3. Enter one of the following queries into the query box.\n\nOn-demand trips example query \n\n SELECT\n timestamp,\n labels.vehicle_id,\n jsonpayload_v1_updatevehiclelog.response.lastlocation.location.latitude AS lat,\n jsonpayload_v1_updatevehiclelog.response.lastlocation.location.longitude AS lng\n FROM\n `ProjectId.TableName.fleetengine_googleapis_com_update_vehicle`\n\nScheduled Tasks example query \n\n SELECT\n labels.delivery_vehicle_id,\n jsonpayload_v1_updatedeliveryvehiclelog.response.lastlocation.rawlocation.longitude as lat, jsonpayload_v1_updatedeliveryvehiclelog.response.lastlocation.rawlocation.latitude as lng\n FROM `ProjectID.TableName.fleetengine_googleapis_com_update_delivery_vehicle`\n\n1. Select **Chart Type as Bubble Map** , and then select the **location** field.\n2. Select **Add a Field**.\n3. Name the field and add the following formula: `CONCAT(lat, \",\", lng)`.\n4. Set the type to **Geo-\\\u003eLatitude, Longitude**.\n5. You can add controls to the dashboard to filter data. For example, select the **Date-range** filter.\n6. Edit the date range box to select a default date range.\n7. You can add additional *drop-down list* controls for `vehicle_id`. With these controls, you can visualize the movement of the vehicle or the movement within a trip.\n\nLooker Studio example output:\n\nWhat's next\n\nTo comply with data retention policies, see [Restrict log\nretention](/maps/documentation/mobility/operations/cloud-logging/reduce-cost)."]]