
BigQuery 是一款功能强大的分析工具。您可以使用它来存储长期日志,并针对数据执行类似 SQL 的查询。如需使用 BigQuery 进行分析,您必须按照下一部分中的说明,将日志明确路由到 BigQuery。
将日志路由到 BigQuery
- 在Logs Explorer中,创建一个过滤条件,
隔离 Fleet Engine 日志:
Fleetengine.googleapis.com/Fleet。 - 在查询结果窗格 中,点击操作 或更多操作 菜单,然后选择创建接收器。
- 指定接收器名称(例如 FleetEngineLogsSink )。 FleetEngineLogsSink点击下一步 。
- 在接收器目的地 中,选择 BigQuery 数据集 。
- 在选择 BigQuery 数据集 中,选择新建 BigQuery 数据集。
- 在创建数据集 对话框中,输入数据集 ID 。
- 其他所有内容保持原样,然后点击创建数据集 。
- 勾选使用分区表 。点击下一步 。
- 将选择要包含在接收器中的日志 和选择要从接收器中过滤掉的日志 保持原样。
- 点击创建接收器 。
您的日志现在应该开始填充 BigQuery 数据集,这可能需要一小段时间。另请参阅将日志路由到支持的目的地。
将日志数据路由到 BigQuery 后,系统会自动填充 FleetEngineLogs 数据集下的多个表,每个日志类型对应一个表:
- CreateVehicle
- GetVehicle
- ListVehicles
- SearchVehicles
- UpdateVehicle
- CreateTrip
- GetTrip
- UpdateTrip
- ListTrips
表名采用以下模式:
project_id.data_set.log_name
例如,如果项目名为 test-project,数据集名称为
FleetEngineLogs,则 CreateTrip 表的名称如下:
test-project.FleetEngineLogs.fleetengine_googleapis_com_create_trip
BigQuery 的示例查询
以下示例查询展示了如何在 BigQuery 中搜索不同的日志条目。
按小时分组的 CreateTrips 日志数
    SELECT TIMESTAMP_TRUNC(timestamp, HOUR) as hour,
           count(*) as num_trips_created
    FROM
    `ProjectId.FleetEngineLogs.fleetengine_googleapis_com_create_trip`
    GROUP BY hour
    ORDER by hour
每辆车每小时的停靠次数
    SELECT
      jsonpayload_v1_updatevehiclelog.request.vehicleid AS vehicle,
      TIMESTAMP_TRUNC(timestamp, HOUR) AS hour,
      COUNT(*) AS num_stops
    FROM
      `ProjectId.FleetEngineLogs.fleetengine_googleapis_com_update__vehicle`
    WHERE
    ARRAY_LENGTH(jsonpayload_v1_updatevehiclelog.request.vehicle.remainingvehiclejourneysegments) > 0
    AND jsonpayload_v1_updatevehiclelog.request.vehicle.remainingvehiclejourneysegments[
    OFFSET
    (0)].stop.state = 'VEHICLE_STOP_STATE_LOG_ARRIVED'
    GROUP BY
    1,
    2
    ORDER BY
    2
例如,此查询可以告诉您,在过去一小时内:
- 车辆 A 在第 12 小时完成了 10 次停靠,在第 13 小时完成了 8 次停靠。
- 车辆 B 在第 11 小时完成了 5 次停靠,在第 12 小时完成了 7 次停靠。
- 车辆 C 在第 13 小时完成了 12 次停靠,在第 14 小时完成了 9 次停靠。
另请参阅查看路由到 BigQuery 的日志。
将 BigQuery 与 Looker Studio 集成
BigQuery 可以与商业智能工具集成,以创建用于业务分析的信息中心。请参阅 Looker Studio。
以下示例展示了如何构建 Looker Studio 信息中心,以在地图上直观呈现行程和车辆移动情况。
- 启动新的 Looker Studio 信息中心,然后选择 BigQuery 作为数据连接。
- 选择自定义查询 ,然后手动输入或选择应向其收取费用的 Cloud 项目。
- 在查询框中输入以下其中一个查询。
按需行程示例查询
    SELECT
     timestamp,
     labels.vehicle_id,
    jsonpayload_v1_updatevehiclelog.response.lastlocation.location.latitude AS lat,
    jsonpayload_v1_updatevehiclelog.response.lastlocation.location.longitude AS lng
    FROM
    `ProjectId.TableName.fleetengine_googleapis_com_update_vehicle`
计划任务示例查询
    SELECT
    labels.delivery_vehicle_id,
    jsonpayload_v1_updatedeliveryvehiclelog.response.lastlocation.rawlocation.longitude as lat, jsonpayload_v1_updatedeliveryvehiclelog.response.lastlocation.rawlocation.latitude as lng
    FROM `ProjectID.TableName.fleetengine_googleapis_com_update_delivery_vehicle`
- 选择图表类型为气泡地图 ,然后选择位置 字段。
- 选择添加字段 。
- 为该字段命名,然后添加以下公式:
CONCAT(lat, ",", lng)。 - 将类型设置为地理位置->纬度、经度。
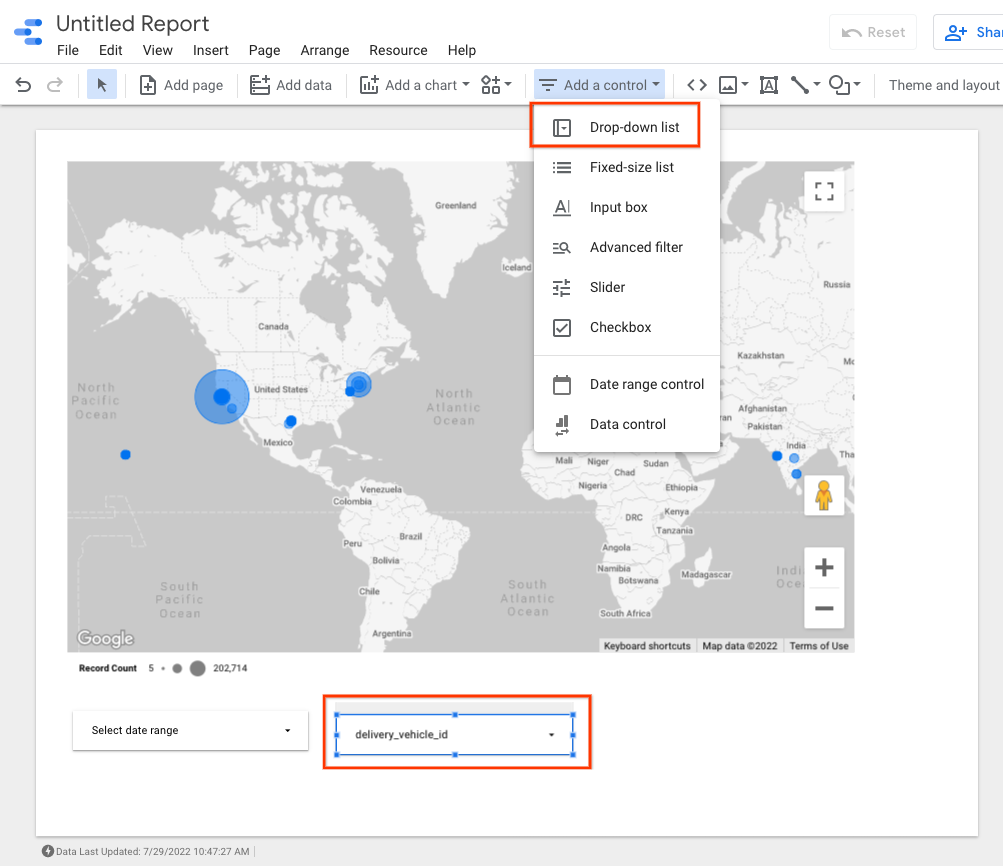
- 您可以向信息中心添加控件来过滤数据。例如,选择日期范围 过滤条件。
- 修改日期范围框以选择默认日期范围。
- 您可以为
vehicle_id添加其他下拉列表控件。 借助这些控件,您可以直观呈现车辆的移动情况或行程内的移动情况。
Looker Studio 示例输出:
后续步骤
如需遵守数据保留政策,请参阅限制日志 保留。