
Fungsi PLACES_COUNT_PER_H3 mengambil area geografis untuk ditelusuri dan menampilkan tabel jumlah tempat per sel H3 di area penelusuran.
Karena fungsi PLACES_COUNT_PER_H3 menampilkan tabel, panggil fungsi tersebut menggunakan
klausa FROM.
Parameter input:
Wajib: Parameter filter
geographyyang menentukan area penelusuran. Parametergeographyadalah nilai yang ditentukan oleh jenis dataGEOGRAPHYBigQuery, yang mendukung titik, linestring, dan poligon.Untuk contoh penggunaan berbagai jenis geografi penelusuran, seperti area tampilan dan garis, lihat fungsi
PLACES_COUNT.Wajib: Parameter filter
h3_resolutionyang menentukan resolusi H3 yang digunakan untuk menggabungkan jumlah tempat di setiap sel H3. Nilai yang didukung adalah dari 0 hingga 11.Opsional: Parameter filter tambahan untuk menyaring penelusuran Anda.
Returns:
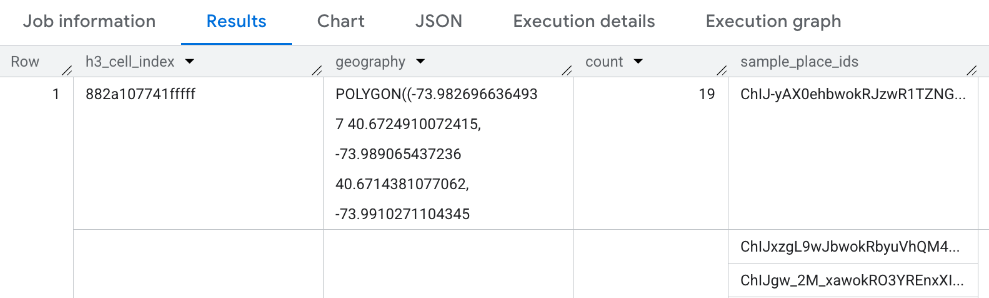
- Tabel dengan satu baris per sel H3. Tabel berisi kolom
h3_cell_index(STRING),geography(GEOGRAPHY) yang menentukan poligon yang merepresentasikan sel H3,count(INT64), dansample_place_ids(ARRAY<STRING>) dengansample_place_idsberisi hingga 250 ID tempat untuk setiap sel H3.
- Tabel dengan satu baris per sel H3. Tabel berisi kolom
Contoh: Hitung jumlah toko serba ada dan toko bahan makanan yang dapat diakses pengguna kursi roda per sel H3
Contoh di bawah menghitung jumlah toko serba ada dan toko bahan makanan yang beroperasi dan dapat diakses dengan kursi roda per sel H3 di New York City. Sel H3 menggunakan tingkat resolusi 8.
Contoh ini menggunakan Data Overture Maps set data publik BigQuery untuk mendapatkan geografi New York City.
DECLARE geo GEOGRAPHY;

-- Get the geography for New York City.
SET geo = (SELECT geometry FROM `bigquery-public-data.overture_maps.division_area`
  WHERE country = 'US' AND subtype = 'locality' AND names.primary = 'New York'  LIMIT 1);

SELECT * FROM `PROJECT_NAME.places_insights___us.PLACES_COUNT_PER_H3`(
  JSON_OBJECT(
      'geography', geo,
      'types', ["convenience_store","grocery_store"],
      'wheelchair_accessible_entrance', true,
      'business_status', ['OPERATIONAL'],
      'h3_resolution', 8
    )
);
Respons untuk fungsi:
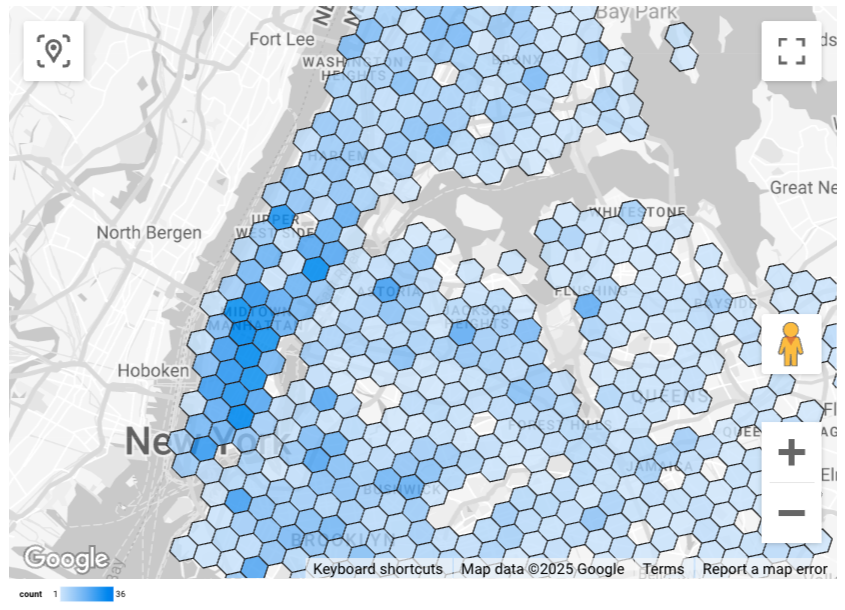
Memvisualisasikan hasil
Gambar berikut menunjukkan data ini ditampilkan di Looker Studio sebagai peta yang diisi. Makin gelap sel H3, makin tinggi konsentrasi hasilnya:
Untuk mengimpor data ke Looker Studio:
Jalankan fungsi di atas untuk membuat hasilnya.
Di hasil BigQuery, klik Open in -> Looker Studio. Hasil Anda akan otomatis diimpor ke Looker Studio.
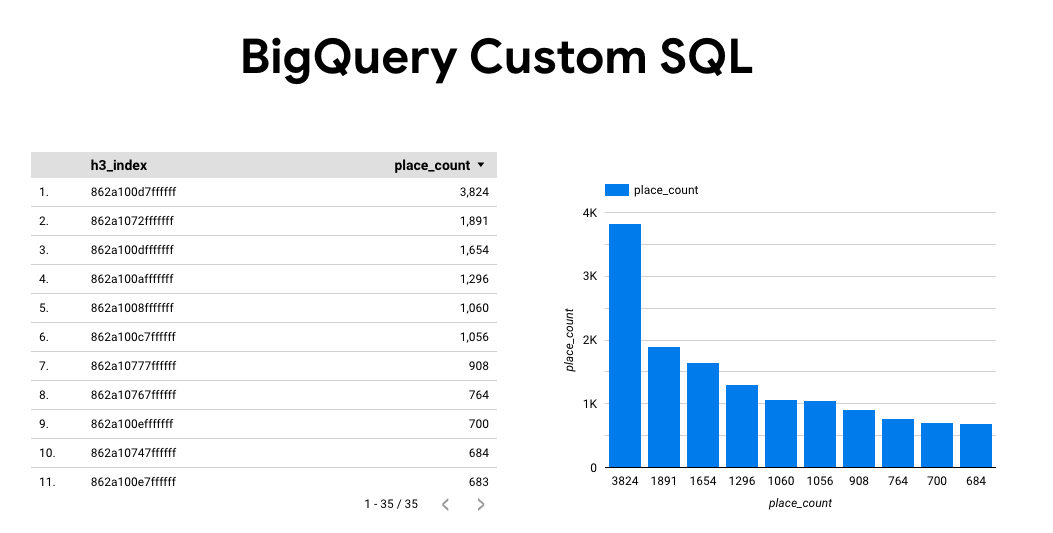
Looker Studio membuat halaman laporan default dan menginisialisasinya dengan judul, tabel, dan grafik batang dari hasil.
Pilih semua yang ada di halaman, lalu hapus.
Klik Sisipkan -> Peta isian untuk menambahkan peta isian ke laporan Anda.
Di bagian Jenis diagram -> Penyiapan, konfigurasi kolom seperti yang ditunjukkan di bawah::
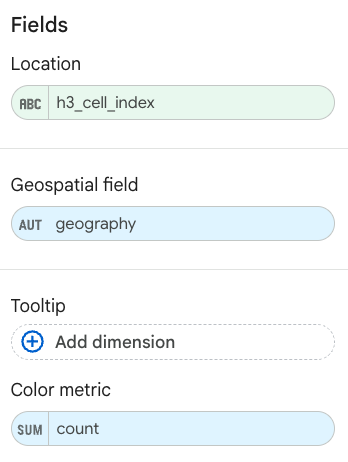
Peta yang diisi akan muncul seperti di atas. Anda dapat memilih Jenis diagram -> Gaya untuk mengonfigurasi lebih lanjut tampilan peta.
Untuk mengetahui informasi dan contoh selengkapnya tentang cara memvisualisasikan hasil Insight Tempat, lihat Memvisualisasikan hasil kueri.