
Funkcja PLACES_COUNT_PER_H3 przyjmuje obszar geograficzny do wyszukania
i zwraca tabelę z liczbą miejsc w komórce H3 w
obszarze wyszukiwania.
Ponieważ funkcja PLACES_COUNT_PER_H3 zwraca tabelę, wywołaj ją za pomocą klauzuli FROM.
Parametry wejściowe:
Wymagany:
geographyparametr filtra, który określa obszar wyszukiwania. Parametrgeographyma wartość zdefiniowaną przez typ danych BigQueryGEOGRAPHY, który obsługuje punkty, linie i wielokąty.Przykłady użycia różnych typów obszarów geograficznych wyszukiwania, takich jak widoczny obszar i linie, znajdziesz w sekcji
PLACES_COUNTfunkcja.Wymagany:
h3_resolutionparametr filtra, który określa rozdzielczość H3 używaną do agregowania liczby miejsc w każdej komórce H3. Obsługiwane wartości to od 0 do 11.Opcjonalny: dodatkowe parametry filtra, które pozwalają zawęzić wyszukiwanie.
Zwraca:
- Tabela z 1 wierszem na komórkę H3. Tabela zawiera kolumny
h3_cell_index(STRING),geography(GEOGRAPHY), która określa wielokąt reprezentujący komórkę H3,count(INT64) isample_place_ids(ARRAY<STRING>), gdziesample_place_idszawiera maksymalnie 250 identyfikatorów miejsc w każdej komórce H3.
- Tabela z 1 wierszem na komórkę H3. Tabela zawiera kolumny
Przykład: zliczanie sklepów ogólnospożywczych i spożywczych dostępnych dla osób na wózkach inwalidzkich w komórce H3
Poniższy przykład oblicza liczbę działających sklepów ogólnospożywczych i spożywczych dostępnych dla osób na wózkach inwalidzkich w komórce H3 w Nowym Jorku. Komórki H3 używają poziomu rozdzielczości 8.
Ten przykład korzysta z Overture Maps Data BigQuery publicznego zbioru danych, aby uzyskać obszar geograficzny Nowego Jorku.
DECLARE geo GEOGRAPHY;

-- Get the geography for New York City.
SET geo = (SELECT geometry FROM `bigquery-public-data.overture_maps.division_area`
  WHERE country = 'US' AND subtype = 'locality' AND names.primary = 'New York'  LIMIT 1);

SELECT * FROM `PROJECT_NAME.places_insights___us.PLACES_COUNT_PER_H3`(
  JSON_OBJECT(
      'geography', geo,
      'types', ["convenience_store","grocery_store"],
      'wheelchair_accessible_entrance', true,
      'business_status', ['OPERATIONAL'],
      'h3_resolution', 8
    )
);
Odpowiedź funkcji:
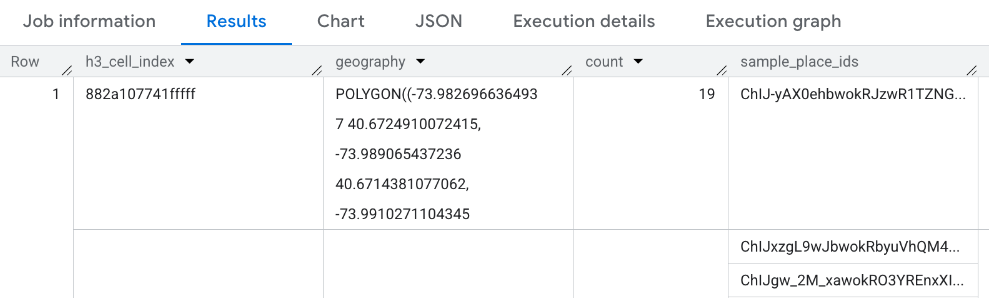
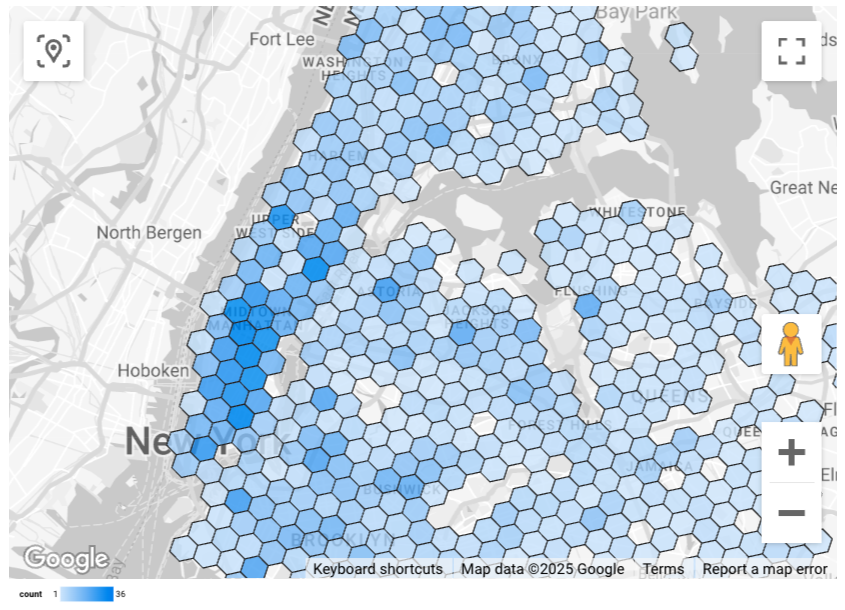
Wizualizacja wyników
Na ilustracjach poniżej widać te dane wyświetlane w Looker Studio jako mapa wypełniona. Im ciemniejsza komórka H3, tym większe zagęszczenie wyników:
Aby zaimportować dane do Looker Studio:
Uruchom funkcję powyżej, aby wygenerować wyniki.
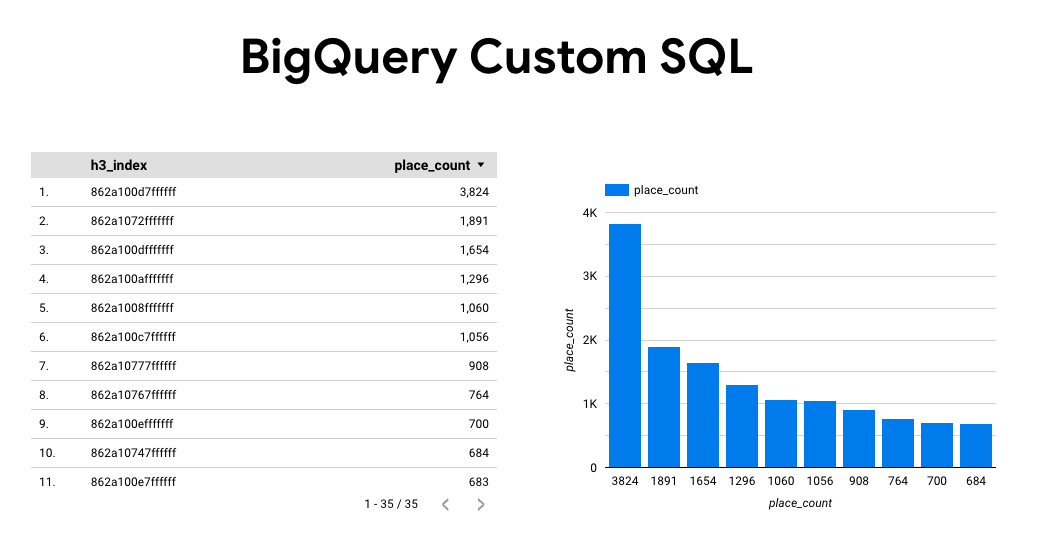
W wynikach BigQuery kliknij Otwórz w -> Looker Studio. Wyniki zostaną automatycznie zaimportowane do Looker Studio.
Looker Studio utworzy domyślną stronę raportu i zainicjuje ją tytułem, tabelą i wykresem słupkowym wyników.
Zaznacz wszystko na stronie i usuń.
Aby dodać do raportu mapę wypełnioną, kliknij Wstaw -> Mapa wypełniona.
W sekcji Typy wykresów -> Konfiguracja skonfiguruj pola tak jak poniżej:
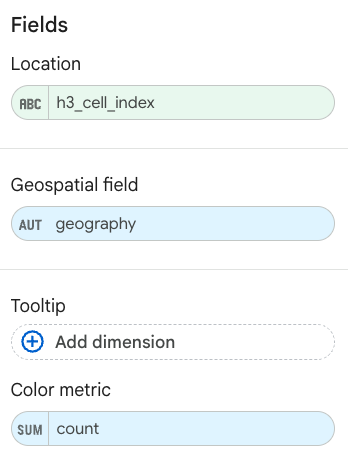
Mapa wypełniona będzie wyglądać jak powyżej. Opcjonalnie możesz kliknąć Typy wykresów -> Style , aby dodatkowo skonfigurować wygląd mapy.
Więcej informacji i przykład wizualizacji wyników Statystyk miejsc znajdziesz w sekcji Wizualizacja wyników zapytania.