
Hàm PLACES_COUNT_PER_H3 lấy một khu vực địa lý để tìm kiếm
và trả về một bảng số lượng địa điểm cho mỗi ô H3 trong
khu vực tìm kiếm.
Vì hàm PLACES_COUNT_PER_H3 trả về một bảng, hãy gọi hàm này bằng cách sử dụng mệnh đề FROM.
Tham số đầu vào:
Bắt buộc: Tham số
geographybộ lọc chỉ định khu vực tìm kiếm. Tham sốgeographylà một giá trị được xác định theo loại dữ liệuGEOGRAPHYcủa BigQuery, hỗ trợ các điểm, chuỗi đường thẳng và đa giác.Để xem ví dụ về cách sử dụng các loại khu vực địa lý tìm kiếm, chẳng hạn như khung nhìn và đường thẳng, hãy xem
PLACES_COUNThàm.Bắt buộc:
h3_resolutionTham số bộ lọc chỉ định độ phân giải H3 dùng để tổng hợp số lượng địa điểm trong mỗi ô H3. Giá trị được hỗ trợ là từ 0 đến 11.Không bắt buộc: Các tham số bộ lọc bổ sung để tinh chỉnh kết quả tìm kiếm.
Trả về:
- Một bảng có một hàng cho mỗi ô H3. Bảng này chứa các cột
h3_cell_index(STRING),geography(GEOGRAPHY) xác định đa giác đại diện cho ô H3,count(INT64), vàsample_place_ids(ARRAY<STRING>) trong đósample_place_idschứa tối đa 250 mã địa điểm cho mỗi ô H3.
- Một bảng có một hàng cho mỗi ô H3. Bảng này chứa các cột
Ví dụ: Đếm số cửa hàng tiện lợi và cửa hàng tạp hoá có lối đi cho xe lăn cho mỗi ô H3
Ví dụ bên dưới tính toán số lượng cửa hàng tiện lợi và cửa hàng tạp hoá đang hoạt động, có lối đi cho xe lăn cho mỗi ô H3 ở Thành phố New York. Các ô H3 sử dụng a mức độ phân giải là 8.
Ví dụ này sử dụng tập dữ liệu công khai Overture Maps Data BigQuery để lấy khu vực địa lý cho Thành phố New York.
DECLARE geo GEOGRAPHY;

-- Get the geography for New York City.
SET geo = (SELECT geometry FROM `bigquery-public-data.overture_maps.division_area`
  WHERE country = 'US' AND subtype = 'locality' AND names.primary = 'New York'  LIMIT 1);

SELECT * FROM `PROJECT_NAME.places_insights___us.PLACES_COUNT_PER_H3`(
  JSON_OBJECT(
      'geography', geo,
      'types', ["convenience_store","grocery_store"],
      'wheelchair_accessible_entrance', true,
      'business_status', ['OPERATIONAL'],
      'h3_resolution', 8
    )
);
Phản hồi cho hàm:
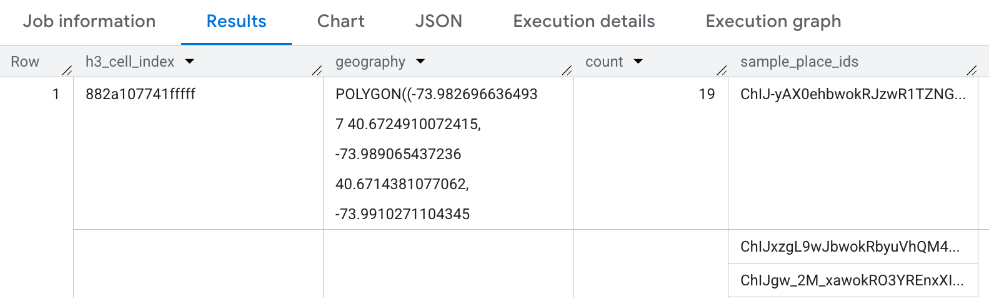
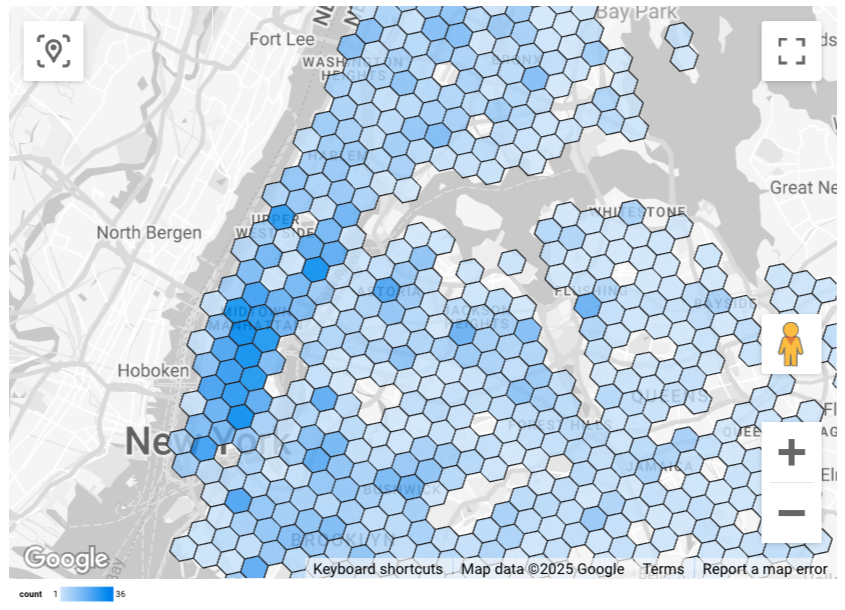
Hình ảnh hoá kết quả
Các hình ảnh sau đây cho thấy dữ liệu này được hiển thị trong Looker Studio dưới dạng bản đồ tô màu. Ô H3 càng tối thì kết quả càng tập trung:
Cách nhập dữ liệu vào Looker Studio:
Chạy hàm ở trên để tạo kết quả.
Trong kết quả BigQuery, hãy nhấp vào Mở trong -> Looker Studio. Kết quả sẽ tự động được nhập vào Looker Studio.
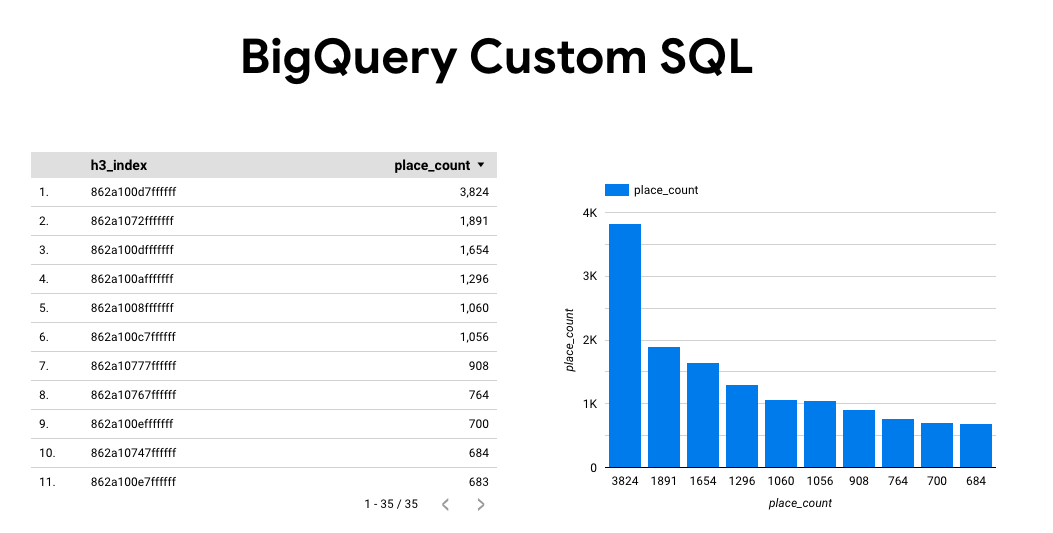
Looker Studio tạo một trang báo cáo mặc định và khởi chạy trang đó bằng tiêu đề, bảng và biểu đồ thanh về kết quả.
Chọn mọi thứ trên trang rồi xoá.
Nhấp vào Chèn -> Bản đồ tô màu để thêm bản đồ tô màu vào báo cáo.
Trong phần Loại biểu đồ -> Thiết lập , hãy định cấu hình các trường như minh hoạ bên dưới:
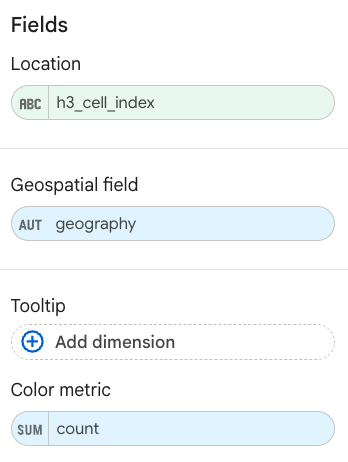
Bản đồ tô màu sẽ xuất hiện như trên. Bạn có thể chọn Loại biểu đồ -> Kiểu để định cấu hình thêm giao diện của bản đồ.
Để biết thêm thông tin và ví dụ về cách hình ảnh hoá kết quả của Thông tin chi tiết về địa điểm, hãy xem phần Hình ảnh hoá kết quả truy vấn.