science המוצר או התכונה האלה נמצאים בגרסת טרום-GA (ניסיונית). יכול להיות שהתמיכה בתכונות ובמוצרים בגרסת טרום-GA תהיה מוגבלת, וששינויים בתכונות ובמוצרים בגרסת טרום-GA לא יהיו תואמים לגרסאות אחרות של טרום-GA. התנאים הספציפיים לשירות של הפלטפורמה של מפות Google חלים על מוצרים בגרסת טרום-GA. מידע נוסף זמין בקטע תיאורים של שלבי ההשקה. להרשמה לבדיקה של התכונה 'תובנות לגבי מקומות'
קל לארגן דפים בעזרת אוספים
אפשר לשמור ולסווג תוכן על סמך ההעדפות שלך.
הפונקציה PLACES_COUNT_PER_H3 מקבלת אזור גיאוגרפי לחיפוש ומחזירה טבלה של ספירת מקומות לכל תא H3 באזור החיפוש.
הפונקציה PLACES_COUNT_PER_GEO מחזירה טבלה, ולכן צריך להפעיל אותה באמצעות פסקה FROM.
פרמטרים של קלט:
חובה: geographyפרמטר הסינון שמציין את אזור החיפוש. הפרמטר geography הוא ערך שמוגדר על ידי סוג הנתונים GEOGRAPHY ב-BigQuery, שתומך בנקודות, בקווי קצה ובמצולעים.
דוגמאות לשימוש בסוגים שונים של אזורים גיאוגרפיים לחיפוש, כמו אזורי תצוגה וקווים, אפשר למצוא במאמר בנושא הפונקציה PLACES_COUNT.
חובה: h3_resolutionפרמטר הסינון שמציין את הרזולוציה של H3 שמשמשת לצבירת מספר המקומות בכל תא H3. הערכים הנתמכים הם 0 עד 8.
טבלה עם שורה אחת לכל תא H3. הטבלה מכילה את העמודות h3_cell_index (STRING), geography (GEOGRAPHY) שמגדירות את הפוליגון שמייצג את תא H3, count (INT64) ו-sample_place_ids (ARRAY<STRING>), כאשר sample_place_ids מכילה עד 250 מזהי מקומות לכל תא H3.
דוגמה: ספירת חנויות נוחות וחנויות מכולת עם נגישות לכיסאות גלגלים בכל תא H3
בדוגמה שלמטה מחושב מספר חנויות הנוחות והמכולות שפועלות ונגישות לכיסא גלגלים לכל תא H3 בניו יורק. התאים של H3 משתמשים ברמת רזולוציה של 8.
DECLAREgeoGEOGRAPHY;-- Get the geography for New York City.SETgeo=(SELECTgeometryFROM`bigquery-public-data.overture_maps.division_area`WHEREcountry='US'ANDnames.primary='City of New York'LIMIT1);SELECT*FROM`maps-platform-analytics-hub.sample_places_insights_us.PLACES_COUNT_PER_H3`(JSON_OBJECT('geography',geo,'types',["convenience_store","grocery_store"],'wheelchair_accessible_entrance',true,'business_status',['OPERATIONAL'],'h3_resolution',8));
התגובה של הפונקציה:
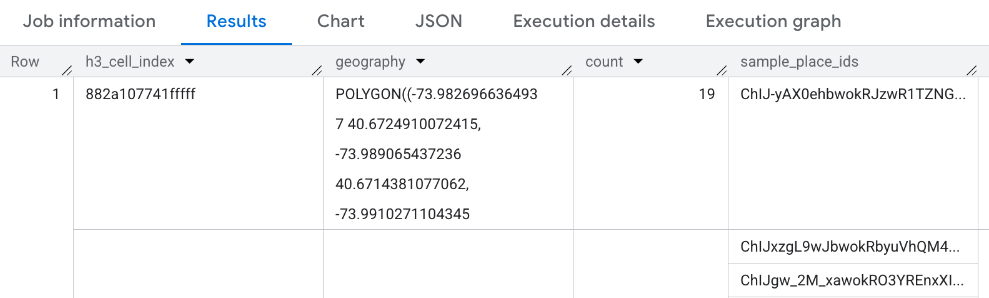
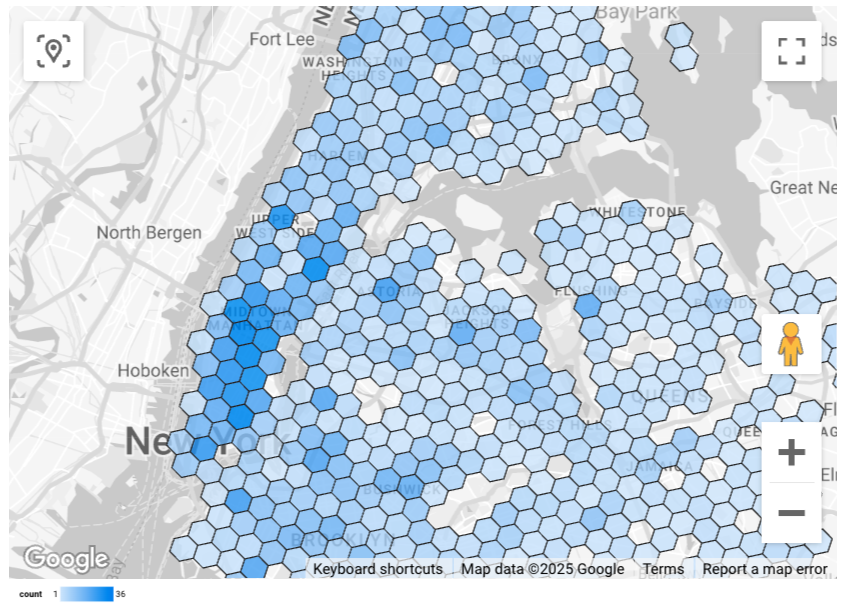
הצגה חזותית של התוצאות
בתמונות הבאות מוצגים הנתונים האלה ב-Looker Studio כמפה עם צבעים.
ככל שהתא H3 כהה יותר, כך ריכוז התוצאות גבוה יותר:
כדי לייבא את הנתונים ל-Looker Studio:
מריצים את הפונקציה שלמעלה כדי ליצור את התוצאות.
בתוצאות של BigQuery, לוחצים על Open in -> Looker Studio (פתיחה ב-Looker Studio). התוצאות מיובאות אוטומטית ל-Looker Studio.
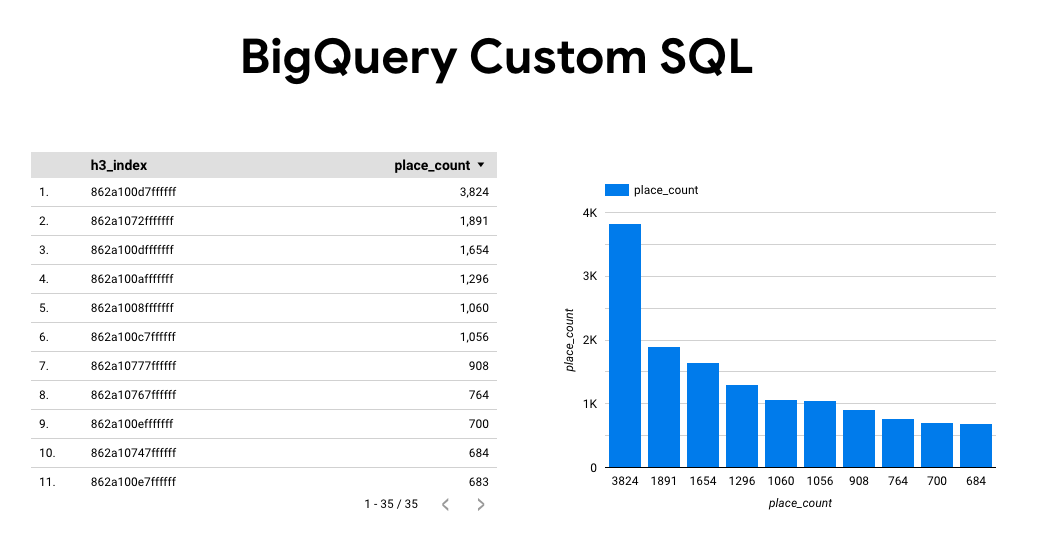
מערכת Looker Studio יוצרת דף דוח שמוגדר כברירת מחדל ומאכלסת אותו בכותרת, בטבלה ובתרשים עמודות של התוצאות.
בוחרים את כל מה שבדף ומוחקים אותו.
כדי להוסיף מפה עם מילוי לדוח, לוחצים על הוספה -> מפה עם מילוי.
בקטע Chart types -> Setup (סוגי תרשימים -> הגדרה), מגדירים את השדות כמו שמוצג בהמשך::
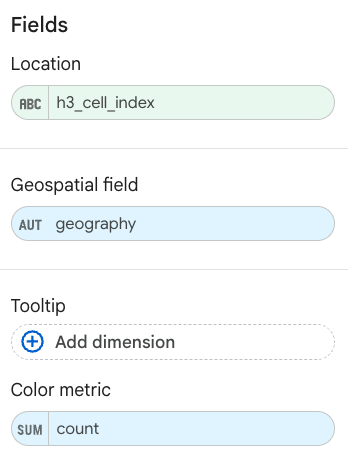
המפה המלאה תיראה כמו בתמונה שלמעלה. אפשר גם לבחור באפשרות סוגי תרשימים -> סגנונות כדי להגדיר עוד את המראה של המפה.
מידע נוסף ודוגמה להדמיה של תוצאות התובנות על מקומות זמינים במאמר בנושא הדמיה של תוצאות שאילתות.
[null,null,["עדכון אחרון: 2025-07-17 (שעון UTC)."],[],[],null,["The `PLACES_COUNT_PER_H3` function takes a geographic area to search\nand returns a table of places counts per [H3](https://h3geo.org/docs/) cell in\nthe search area.\n\nBecause the `PLACES_COUNT_PER_GEO` function returns a table, call it using\na `FROM` clause.\n\n- Input parameters:\n\n - **Required** : The `geography` [filter parameter](/maps/documentation/placesinsights/experimental/filter-params) that\n specifies the search area. The `geography` parameter a value defined by\n the BigQuery\n [`GEOGRAPHY`](https://cloud.google.com/bigquery/docs/reference/standard-sql/data-types#geography_type)\n data type, which supports points, linestrings, and polygons.\n\n For examples of using different types of search geographies, such as\n viewports and lines, see\n [`PLACES_COUNT` function](/maps/documentation/placesinsights/experimental/places-count).\n - **Required** : The `h3_resolution` [filter parameter](/maps/documentation/placesinsights/experimental/filter-params) that\n specifies the [H3](https://h3geo.org/docs/) resolution used to aggregate\n the count of places in each H3 cell. Supported value are from 0 to 8.\n\n - **Optional** : Additional [filter](/maps/documentation/placesinsights/experimental/filter-params) parameters to refine\n your search.\n\n- Returns:\n\n - A table with one row per H3 cell. The table contains the columns `h3_cell_index` (`STRING`), `geography` (`GEOGRAPHY`) which defines the polygon representing the H3 cell, and `count` (`INT64`).\n\nExample: Count wheelchair accessible convenience and grocery stores per H3 cell\n\nThe example below computes the number of operational, wheelchair accessible\nconvenience and grocery stores per H3 cell in New York City. The H3 cells use a\n[resolution level](https://h3geo.org/docs/core-library/restable) of 8.\n\nThis example uses the [Overture Maps\nData](https://console.cloud.google.com/marketplace/product/bigquery-public-data/overture-maps)\nBigQuery [public dataset](https://cloud.google.com/bigquery/public-data) to get\nthe geography for New York City.\n| **Note:** Because the response table contains a `geography` field, you can visualize it using tools that support BigQuery `GEOGRAPHY` types. For an example of visualizing the results of a function, see [Visualize\nresults](#visualize_results). For more information and example on visualizing Places Insights results, see [Visualize query results](/maps/documentation/placesinsights/visualize-data). \n\n```googlesql\nDECLARE geo GEOGRAPHY;\n\n-- Get the geography for New York City.\nSET geo = (SELECT geometry FROM `bigquery-public-data.overture_maps.division_area`\n WHERE country = 'US' AND names.primary = 'City of New York' LIMIT 1);\n\nSELECT * FROM `maps-platform-analytics-hub.sample_places_insights_us.PLACES_COUNT_PER_H3`(\n JSON_OBJECT(\n 'geography', geo,\n 'types', [\"convenience_store\",\"grocery_store\"],\n 'wheelchair_accessible_entrance', true,\n 'business_status', ['OPERATIONAL'],\n 'h3_resolution', 8\n )\n);\n```\n\nThe response for the function:\n\nVisualize results\n\nThe following images show this data displayed in Looker Studio as a filled map.\nThe darker the H3 cell the higher the concentration of results:\n\nTo import your data into Looker Studio:\n\n1. Run the function above to generate the results.\n\n2. In the BigQuery results, click **Open in -\\\u003e Looker Studio**. Your results\n are automatically imported into Looker Studio.\n\n3. Looker Studio creates a default report page and initializes it with a title,\n table, and bar graph of the results.\n\n4. Select everything on the page and delete it.\n\n5. Click **Insert -\\\u003e Filled map** to add a filled map to your report.\n\n6. Under **Chart types -\\\u003e Setup** configure the fields as shown below::\n\n7. The filled map appears as above. You can optionally select **Chart types -\\\u003e\n Styles** to further configure the appearance of the map.\n\nFor more information and example on visualizing Places Insights results, see\n[Visualize query results](/maps/documentation/placesinsights/visualize-data)."]]