ヒートマップ
コレクションでコンテンツを整理
必要に応じて、コンテンツの保存と分類を行います。
heatmapTiles エンドポイントは、タイル オーバーレイを通じて花粉関連のヒートマップを提供します。タイル オーバーレイは、Google マップ上に表示できる画像タイルのコレクションです。各画像タイルは 256 x 256 ピクセルです。
タイル オーバーレイは、タイルのコレクションから組み立てられたグリッドで、各タイルには(X
、Y
)座標が割り当てられています。座標(0,0)のタイルは常にマップの北西隅にあります。X
の値は西から東に増分し、Y
の値は北から南に増分します。
zoom level
は、地図ビューに表示される地図のコンテンツの大きさを決定します。タイルグリッドのサイズは、X
座標と Y
座標をズームレベルで指数関数的にスケーリングすることで決まります。
gridSizeX = XzoomLevel
gridSizeY = YzoomLevel
たとえば、ズームレベル 2 では、世界地図は 4 x 4 の行列で表され、合計 16 個のタイルになります。
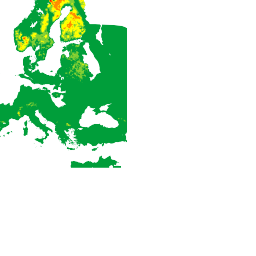
次の画像は、全世界の TREE_UPI
ヒートマップを示しています。このヒートマップは、ズームレベル 2 でアクセスできるタイルに分割されています。

詳しくは、地図とタイル座標をご覧ください。
HTTP GET リクエストを次の URL に送信することで、現在の花粉ヒートマップ タイルを
heatmapTiles エンドポイントを使用してリクエストできます。
https://pollen.googleapis.com/v1/mapTypes/TYPE/heatmapTiles/Z/X/Y?key=YOUR_API_KEY
ヒートマップ エンドポイントについて
リクエストを成功させるには、以下のすべてのパラメータが必要です。
KEY
: アプリケーションの API キー。このキーは、割り当て管理の目的でアプリケーションを識別します。キーを取得する方法を確認する。
TYPE
: 返すヒートマップのタイプ。許容値をご覧ください。
Z
: 地図ビューで地図のコンテンツがどのくらいの大きさで表示されるかを決定するズームレベル。使用できる値は 0 ~ 16 です。値が 0 の場合は、全世界が 1 つのタイルに表示されます。
X
、Y
: 北東の角(0,0)を基準としたタイルの座標。X
値は西から東に増分し、Y
値は北から南に増分します。座標は、指定されたズームレベルで有効である必要があります。たとえば、ズームレベルを 2 に設定して座標(10,10)のタイルをリクエストすると、API はエラーを返します。
ヒートマップ リクエストの例
上の画像は、ズームレベル 2 の TREE_UPI
ヒートマップと、各タイルの座標を示しています。次の例では、heatmapTiles
エンドポイントを使用して、座標(2,1)のタイルをリクエストしています。
https://pollen.googleapis.com/v1/mapTypes/TREE_UPI/heatmapTiles/2/2/1?key=YOUR_API_KEY
タイルは、地図に重ね合わせることができる画像として表示されます。

デフォルトの地図の上にタイルをオーバーレイする方法については、地図タイプのオーバーレイをご覧ください。
特に記載のない限り、このページのコンテンツはクリエイティブ・コモンズの表示 4.0 ライセンスにより使用許諾されます。コードサンプルは Apache 2.0 ライセンスにより使用許諾されます。詳しくは、Google Developers サイトのポリシーをご覧ください。Java は Oracle および関連会社の登録商標です。
最終更新日 2025-08-31 UTC。
[null,null,["最終更新日 2025-08-31 UTC。"],[[["\u003cp\u003eThe heatmapTiles endpoint delivers pollen heatmaps as tile overlays, which are collections of 256x256 pixel image tiles displayed on top of Google Maps.\u003c/p\u003e\n"],["\u003cp\u003eTile coordinates (X,Y) determine the grid position, with (0,0) at the northwest corner and increasing values eastward for X and southward for Y.\u003c/p\u003e\n"],["\u003cp\u003eZoom level (Z) controls map content size and grid dimensions, ranging from 0 (entire world) to 16, influencing tile coordinates validity.\u003c/p\u003e\n"],["\u003cp\u003eTo request heatmap tiles, use the heatmapTiles endpoint with required parameters: API key, heatmap type, zoom level, and tile coordinates (X,Y).\u003c/p\u003e\n"],["\u003cp\u003eYou can overlay these pollen heatmap tiles onto existing maps for visualization, enhancing applications with pollen information.\u003c/p\u003e\n"]]],["The `heatmapTiles` endpoint provides pollen heatmaps as image tiles (256x256 pixels) overlaid on Google Maps. Tiles are arranged in a grid with (X,Y) coordinates, starting from (0,0) in the northwest. The zoom level (0-16) dictates map detail, scaling the grid exponentially (gridSizeX = X^zoomLevel). A request to the endpoint requires an API key, heatmap `TYPE`, `Z` zoom level, and `X`, `Y` tile coordinates. The format for a request is: `https://pollen.googleapis.com/v1/mapTypes/TYPE/heatmapTiles/Z/X/Y?key=YOUR_API_KEY`\n"],null,["# Heatmaps\n\nThe\n[heatmapTiles](/maps/documentation/pollen/reference/rest/v1/mapTypes.heatmapTiles/lookupHeatmapTile)\nendpoint provides pollen-related heatmaps through tile overlay. A tile overlay\nis a collection of image tiles that can be displayed on top of Google Maps. Each\nimage tile is 256 x 256 pixels.\n\nThe tile overlay is a grid assembled from a collection of tiles, each assigned\n(`X`,`Y`) coordinates. The tile with coordinates (0,0) is always at the\nnorthwest corner of the map. The `X` values increase from west to east, while\nthe `Y` values increase from north to south.\n\nThe `zoom level` determines how large or small the contents of a map appear in a\nmap view. The tile grid size is determined by scaling the `X` and `Y`\ncoordinates exponentially by the zoom level. \n\n```text\ngridSizeX = XzoomLevel\ngridSizeY = YzoomLevel\n```\n\nFor example, at a zoom level of 2, the world map is represented using a 4 x 4\nmatrix, for a total of 16 tiles.\n\nThe following image shows a `TREE_UPI` heatmap of the entire world, sectioned\ninto tiles that can be accessed at a zoom level of 2.\n\nSee [Map and Tile\ncoordinates](/maps/documentation/javascript/coordinates#tile-coordinates) for\nadditional details.\n\nYou can request current pollen heatmap tiles using the [heatmapTiles](/maps/documentation/pollen/reference/rest/v1/mapTypes.heatmapTiles/lookupHeatmapTile)\nendpoint by sending an HTTP GET request to: \n\n```html\nhttps://pollen.googleapis.com/v1/mapTypes/TYPE/heatmapTiles/Z/X/Y?key=YOUR_API_KEY\n```\n\nAbout the heatmap endpoint\n--------------------------\n\nAll parameters listed below are required for a successful request:\n\n- `KEY`: Your application's API key. This key identifies your application for purposes of quota management. Learn how to [get a\n key](/maps/documentation/pollen/get-api-key).\n- `TYPE`: The type of heatmap to return. See [allowed\n values](/maps/documentation/pollen/reference/rest/v1/mapTypes.heatmapTiles/lookupHeatmapTile#maptype).\n- `Z`: Zoom level that determines how large or small the contents of a map appear in a map view. Allowed values are 0-16, where a value of 0 displays the entire world in a single tile.\n- `X`,`Y`: The tile coordinates relatively to the north east corner (0,0). `X` values increase from west to east and `Y` values increase from north to south. Coordinates must be valid for the specified zoom level. For example, if you set the zoom level to 2 and request a tile at coordinates (10,10), the API returns an error.\n\nExample heatmap request\n-----------------------\n\nThe image above shows a `TREE_UPI` heatmap with a zoom level of 2, along with\nthe coordinates of each tile. The following example uses the `heatmapTiles`\nendpoint to request the tile at coordinates (2,1): \n\n```html\nhttps://pollen.googleapis.com/v1/mapTypes/TREE_UPI/heatmapTiles/2/2/1?key=YOUR_API_KEY\n```\n\nThe tile appears as an image that can be overlaid on a map:\n\nFor more information on overlaying tiles on top of the default map, see\n[Overlay Map Types](/maps/documentation/javascript/examples/maptype-overlay)."]]