히트맵
컬렉션을 사용해 정리하기
내 환경설정을 기준으로 콘텐츠를 저장하고 분류하세요.
heatmapTiles 엔드포인트는 타일 오버레이를 통해 꽃가루 관련 히트맵을 제공합니다. 타일 오버레이는 Google 지도 위에 표시할 수 있는 이미지 타일 모음입니다. 각 이미지 타일은 256x256픽셀입니다.
타일 오버레이는 타일 모음으로 조립된 그리드이며 각 타일에는 (X
,Y
) 좌표가 할당됩니다. 좌표가 (0,0)인 타일은 언제나 지도의 북서쪽 모서리에 있습니다. X
값은 서쪽에서 동쪽으로 갈수록 증가하고 Y
값은 북쪽에서 남쪽으로 갈수록 증가합니다.
zoom level
는 지도 뷰에 지도의 콘텐츠가 표시되는 크기를 결정합니다. 타일 그리드 크기는 X
및 Y
좌표를 확대/축소 수준에 따라 지수적으로 조정하여 결정됩니다.
gridSizeX = XzoomLevel
gridSizeY = YzoomLevel
예를 들어 확대/축소 수준이 2인 경우 세계 지도는 4x4 행렬을 사용하여 총 16개의 타일로 표시됩니다.
다음 이미지는 확대/축소 수준 2에서 액세스할 수 있는 타일로 구분된 전 세계의 TREE_UPI
히트맵을 보여줍니다.

자세한 내용은 지도 및 타일 좌표를 참고하세요.
다음과 같이 HTTP GET 요청을 전송하여
heatmapTiles 엔드포인트를 사용하여 현재 꽃가루 히트맵 타일을 요청할 수 있습니다.
https://pollen.googleapis.com/v1/mapTypes/TYPE/heatmapTiles/Z/X/Y?key=YOUR_API_KEY
히트맵 엔드포인트 정보
아래에 나열된 모든 매개변수는 요청이 성공하려면 필수입니다.
KEY
: 애플리케이션의 API 키입니다. 이 키는 할당량 관리를 위해 애플리케이션을 식별합니다. 키를 가져오는 방법을 알아보세요.
TYPE
: 반환할 히트맵의 유형입니다. 허용된 값을 참고하세요.
Z
: 지도 뷰에 지도의 콘텐츠가 얼마나 크게 또는 작게 표시되는지를 결정하는 확대/축소 수준입니다. 허용되는 값은 0~16이며, 값 0은 전체 세계를 하나의 타일에 표시합니다.
X
,Y
: 북동쪽 모서리 (0,0)를 기준으로 한 타일 좌표입니다. X
값은 서쪽에서 동쪽으로 갈수록 증가하고 Y
값은 북쪽에서 남쪽으로 갈수록 증가합니다. 좌표는 지정된 확대/축소 수준에 유효해야 합니다. 예를 들어 확대/축소 수준을 2로 설정하고 좌표 (10,10)에서 타일을 요청하면 API가 오류를 반환합니다.
히트맵 요청 예시
위 이미지는 확대 수준이 2인 TREE_UPI
히트맵과 각 타일의 좌표를 보여줍니다. 다음 예에서는 heatmapTiles
엔드포인트를 사용하여 좌표 (2,1)의 타일을 요청합니다.
https://pollen.googleapis.com/v1/mapTypes/TREE_UPI/heatmapTiles/2/2/1?key=YOUR_API_KEY
타일은 지도에 오버레이할 수 있는 이미지로 표시됩니다.
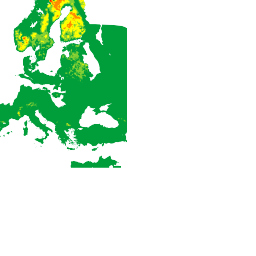
기본 지도 위에 타일을 오버레이하는 방법에 관한 자세한 내용은 지도 유형 오버레이를 참고하세요.
달리 명시되지 않는 한 이 페이지의 콘텐츠에는 Creative Commons Attribution 4.0 라이선스에 따라 라이선스가 부여되며, 코드 샘플에는 Apache 2.0 라이선스에 따라 라이선스가 부여됩니다. 자세한 내용은 Google Developers 사이트 정책을 참조하세요. 자바는 Oracle 및/또는 Oracle 계열사의 등록 상표입니다.
최종 업데이트: 2025-08-31(UTC)
[null,null,["최종 업데이트: 2025-08-31(UTC)"],[[["\u003cp\u003eThe heatmapTiles endpoint delivers pollen heatmaps as tile overlays, which are collections of 256x256 pixel image tiles displayed on top of Google Maps.\u003c/p\u003e\n"],["\u003cp\u003eTile coordinates (X,Y) determine the grid position, with (0,0) at the northwest corner and increasing values eastward for X and southward for Y.\u003c/p\u003e\n"],["\u003cp\u003eZoom level (Z) controls map content size and grid dimensions, ranging from 0 (entire world) to 16, influencing tile coordinates validity.\u003c/p\u003e\n"],["\u003cp\u003eTo request heatmap tiles, use the heatmapTiles endpoint with required parameters: API key, heatmap type, zoom level, and tile coordinates (X,Y).\u003c/p\u003e\n"],["\u003cp\u003eYou can overlay these pollen heatmap tiles onto existing maps for visualization, enhancing applications with pollen information.\u003c/p\u003e\n"]]],["The `heatmapTiles` endpoint provides pollen heatmaps as image tiles (256x256 pixels) overlaid on Google Maps. Tiles are arranged in a grid with (X,Y) coordinates, starting from (0,0) in the northwest. The zoom level (0-16) dictates map detail, scaling the grid exponentially (gridSizeX = X^zoomLevel). A request to the endpoint requires an API key, heatmap `TYPE`, `Z` zoom level, and `X`, `Y` tile coordinates. The format for a request is: `https://pollen.googleapis.com/v1/mapTypes/TYPE/heatmapTiles/Z/X/Y?key=YOUR_API_KEY`\n"],null,["# Heatmaps\n\nThe\n[heatmapTiles](/maps/documentation/pollen/reference/rest/v1/mapTypes.heatmapTiles/lookupHeatmapTile)\nendpoint provides pollen-related heatmaps through tile overlay. A tile overlay\nis a collection of image tiles that can be displayed on top of Google Maps. Each\nimage tile is 256 x 256 pixels.\n\nThe tile overlay is a grid assembled from a collection of tiles, each assigned\n(`X`,`Y`) coordinates. The tile with coordinates (0,0) is always at the\nnorthwest corner of the map. The `X` values increase from west to east, while\nthe `Y` values increase from north to south.\n\nThe `zoom level` determines how large or small the contents of a map appear in a\nmap view. The tile grid size is determined by scaling the `X` and `Y`\ncoordinates exponentially by the zoom level. \n\n```text\ngridSizeX = XzoomLevel\ngridSizeY = YzoomLevel\n```\n\nFor example, at a zoom level of 2, the world map is represented using a 4 x 4\nmatrix, for a total of 16 tiles.\n\nThe following image shows a `TREE_UPI` heatmap of the entire world, sectioned\ninto tiles that can be accessed at a zoom level of 2.\n\nSee [Map and Tile\ncoordinates](/maps/documentation/javascript/coordinates#tile-coordinates) for\nadditional details.\n\nYou can request current pollen heatmap tiles using the [heatmapTiles](/maps/documentation/pollen/reference/rest/v1/mapTypes.heatmapTiles/lookupHeatmapTile)\nendpoint by sending an HTTP GET request to: \n\n```html\nhttps://pollen.googleapis.com/v1/mapTypes/TYPE/heatmapTiles/Z/X/Y?key=YOUR_API_KEY\n```\n\nAbout the heatmap endpoint\n--------------------------\n\nAll parameters listed below are required for a successful request:\n\n- `KEY`: Your application's API key. This key identifies your application for purposes of quota management. Learn how to [get a\n key](/maps/documentation/pollen/get-api-key).\n- `TYPE`: The type of heatmap to return. See [allowed\n values](/maps/documentation/pollen/reference/rest/v1/mapTypes.heatmapTiles/lookupHeatmapTile#maptype).\n- `Z`: Zoom level that determines how large or small the contents of a map appear in a map view. Allowed values are 0-16, where a value of 0 displays the entire world in a single tile.\n- `X`,`Y`: The tile coordinates relatively to the north east corner (0,0). `X` values increase from west to east and `Y` values increase from north to south. Coordinates must be valid for the specified zoom level. For example, if you set the zoom level to 2 and request a tile at coordinates (10,10), the API returns an error.\n\nExample heatmap request\n-----------------------\n\nThe image above shows a `TREE_UPI` heatmap with a zoom level of 2, along with\nthe coordinates of each tile. The following example uses the `heatmapTiles`\nendpoint to request the tile at coordinates (2,1): \n\n```html\nhttps://pollen.googleapis.com/v1/mapTypes/TREE_UPI/heatmapTiles/2/2/1?key=YOUR_API_KEY\n```\n\nThe tile appears as an image that can be overlaid on a map:\n\nFor more information on overlaying tiles on top of the default map, see\n[Overlay Map Types](/maps/documentation/javascript/examples/maptype-overlay)."]]