Конечная точка heatmapTiles предоставляет тепловые карты, связанные с пыльцой, посредством наложения плиток. Наложение плиток — это набор изображений, которые можно отображать поверх Google Карт. Размер каждого изображения составляет 256 x 256 пикселей.
Наложение тайлов представляет собой сетку, составленную из набора тайлов, каждому из которых присвоены координаты ( X , Y ). Тайл с координатами (0,0) всегда находится в северо-западном углу карты. Значения X увеличиваются с запада на восток, а значения Y — с севера на юг.
zoom level определяет, насколько крупным или мелким будет изображение на карте. Размер сетки фрагментов определяется экспоненциальным масштабированием координат X и Y в зависимости от уровня масштабирования.
gridSizeX = XzoomLevel
gridSizeY = YzoomLevel
Например, при уровне масштабирования 2 карта мира представляется с использованием матрицы 4 x 4, что в общей сложности составляет 16 плиток.
На следующем изображении показана тепловая карта TREE_UPI всего мира, разделенная на фрагменты, доступ к которым возможен при уровне масштабирования 2.

Дополнительную информацию смотрите в разделе «Координаты карты и плитки» .
Вы можете запросить текущие плитки тепловой карты пыльцы, используя конечную точку heatmapTiles , отправив HTTP-запрос GET по адресу:
https://pollen.googleapis.com/v1/mapTypes/TYPE/heatmapTiles/Z/X/Y?key=YOUR_API_KEY
О конечной точке тепловой карты
Для успешного запроса необходимы все перечисленные ниже параметры:
-
KEY: API-ключ вашего приложения. Этот ключ идентифицирует ваше приложение для управления квотами. Узнайте, как получить ключ . -
TYPE: Тип возвращаемой тепловой карты. См. допустимые значения . -
Z: Уровень масштабирования, определяющий, насколько крупным или мелким будет изображение на карте. Допустимые значения: от 0 до 16, где значение 0 отображает весь мир на одной плитке. -
X,Y: координаты тайла относительно северо-восточного угла (0,0). ЗначенияXувеличиваются с запада на восток, а значенияY— с севера на юг. Координаты должны соответствовать указанному уровню масштабирования. Например, если установить уровень масштабирования 2 и запросить тайл с координатами (10,10), API вернёт ошибку.
Пример запроса тепловой карты
На изображении выше показана тепловая карта TREE_UPI с уровнем масштабирования 2 и координатами каждого тайла. В следующем примере конечная точка heatmapTiles используется для запроса тайла с координатами (2,1):
https://pollen.googleapis.com/v1/mapTypes/TREE_UPI/heatmapTiles/2/2/1?key=YOUR_API_KEY
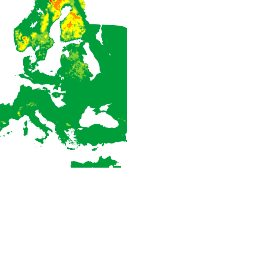
Плитка отображается в виде изображения, которое можно наложить на карту:
Дополнительную информацию о наложении плиток поверх карты по умолчанию см. в разделе Типы наложенных карт .