خرائط التمثيل اللوني
تنظيم صفحاتك في مجموعات
يمكنك حفظ المحتوى وتصنيفه حسب إعداداتك المفضّلة.
تقدّم نقطة نهاية
heatmapTiles
خرائط حرارية متعلقة بحبوب اللقاح من خلال طبقة مربّعات. تراكب المربّعات هو مجموعة من مربّعات الصور التي يمكن عرضها فوق "خرائط Google". يبلغ حجم كل
مربّع صورة 256 × 256 بكسل.
تراكب الصور هو شبكة مجمّعة من مجموعة من الصور، ويتم تعيين إحداثيات (X
،Y
) لكل صورة. يقع المربع الذي يتضمّن الإحداثيات (0,0) دائمًا في الزاوية الشمالية الغربية من الخريطة. تزداد قيم X
من الغرب إلى الشرق، بينما تزداد قيم Y
من الشمال إلى الجنوب.
يحدّد zoom level
حجم المحتوى الذي يظهر في عرض الخريطة. يتم تحديد حجم شبكة المربّعات من خلال تغيير مقياس الإحداثيات X
وY
بشكل أُسّي حسب مستوى التكبير/التصغير.
gridSizeX = XzoomLevel
gridSizeY = YzoomLevel
على سبيل المثال، عند مستوى تكبير/تصغير 2، يتم تمثيل خريطة العالم باستخدام مصفوفة 4 × 4، أي ما مجموعه 16 مربّعًا.
تعرض الصورة التالية خريطة حرارية TREE_UPI
للعالم بأسره، مقسّمة إلى مربّعات يمكن الوصول إليها بمستوى تكبير 2.

يمكنك الاطّلاع على إحداثيات الخريطة والمربّع للحصول على تفاصيل إضافية.
يمكنك طلب مربّعات خريطة حرارية حالية لحبوب اللقاح باستخدام نقطة النهاية
heatmapTiles
عن طريق إرسال طلب استرداد بيانات باستخدام GET HTTP إلى:
https://pollen.googleapis.com/v1/mapTypes/TYPE/heatmapTiles/Z/X/Y?key=YOUR_API_KEY
لمحة عن نقطة نهاية خريطة التمثيل اللوني
يجب توفُّر جميع المَعلمات المُدرَجة أدناه لإجراء طلب ناجح:
KEY
: مفتاح واجهة برمجة التطبيقات لتطبيقك يحدّد هذا المفتاح تطبيقك لأغراض إدارة الحصة. كيفية الحصول على
مفتاح
TYPE
: نوع خريطة التمثيل اللوني المطلوب إرجاعها. يُرجى الاطّلاع على القيم المسموح بها.
Z
: مستوى التكبير أو التصغير الذي يحدّد حجم المحتوى المعروض في الخريطة. تتراوح القيم المسموح بها بين 0 و16، حيث تعرض القيمة 0 العالم بأسره في مربّع واحد.
-
X
،Y
: إحداثيات المربّع بالنسبة إلى الزاوية الشمالية الشرقية (0,0) تزداد قيم X
من الغرب إلى الشرق، وتزداد قيم Y
من الشمال إلى الجنوب. يجب أن تكون الإحداثيات صالحة لمستوى التكبير/التصغير المحدّد. على سبيل المثال، إذا ضبطت مستوى التكبير/التصغير على 2 وطلبت مربّعًا في الإحداثيات (10,10)، ستعرض واجهة برمجة التطبيقات رسالة خطأ.
مثال على طلب خريطة التمثيل اللوني
تعرض الصورة أعلاه خريطة حرارية TREE_UPI
بمستوى تكبير 2، بالإضافة إلى إحداثيات كل مربّع. يستخدم المثال التالي نقطة النهاية heatmapTiles
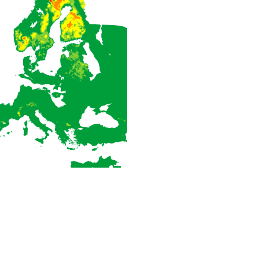
لطلب المربّع في الإحداثيات (2,1):
https://pollen.googleapis.com/v1/mapTypes/TREE_UPI/heatmapTiles/2/2/1?key=YOUR_API_KEY
يظهر المربّع كصورة يمكن وضعها فوق خريطة:

لمزيد من المعلومات عن تراكب المربّعات على الخريطة التلقائية، يُرجى الاطّلاع على أنواع الخرائط المتراكبة.
إنّ محتوى هذه الصفحة مرخّص بموجب ترخيص Creative Commons Attribution 4.0 ما لم يُنصّ على خلاف ذلك، ونماذج الرموز مرخّصة بموجب ترخيص Apache 2.0. للاطّلاع على التفاصيل، يُرجى مراجعة سياسات موقع Google Developers. إنّ Java هي علامة تجارية مسجَّلة لشركة Oracle و/أو شركائها التابعين.
تاريخ التعديل الأخير: 2025-08-31 (حسب التوقيت العالمي المتفَّق عليه)
[null,null,["تاريخ التعديل الأخير: 2025-08-31 (حسب التوقيت العالمي المتفَّق عليه)"],[[["\u003cp\u003eThe heatmapTiles endpoint delivers pollen heatmaps as tile overlays, which are collections of 256x256 pixel image tiles displayed on top of Google Maps.\u003c/p\u003e\n"],["\u003cp\u003eTile coordinates (X,Y) determine the grid position, with (0,0) at the northwest corner and increasing values eastward for X and southward for Y.\u003c/p\u003e\n"],["\u003cp\u003eZoom level (Z) controls map content size and grid dimensions, ranging from 0 (entire world) to 16, influencing tile coordinates validity.\u003c/p\u003e\n"],["\u003cp\u003eTo request heatmap tiles, use the heatmapTiles endpoint with required parameters: API key, heatmap type, zoom level, and tile coordinates (X,Y).\u003c/p\u003e\n"],["\u003cp\u003eYou can overlay these pollen heatmap tiles onto existing maps for visualization, enhancing applications with pollen information.\u003c/p\u003e\n"]]],["The `heatmapTiles` endpoint provides pollen heatmaps as image tiles (256x256 pixels) overlaid on Google Maps. Tiles are arranged in a grid with (X,Y) coordinates, starting from (0,0) in the northwest. The zoom level (0-16) dictates map detail, scaling the grid exponentially (gridSizeX = X^zoomLevel). A request to the endpoint requires an API key, heatmap `TYPE`, `Z` zoom level, and `X`, `Y` tile coordinates. The format for a request is: `https://pollen.googleapis.com/v1/mapTypes/TYPE/heatmapTiles/Z/X/Y?key=YOUR_API_KEY`\n"],null,["# Heatmaps\n\nThe\n[heatmapTiles](/maps/documentation/pollen/reference/rest/v1/mapTypes.heatmapTiles/lookupHeatmapTile)\nendpoint provides pollen-related heatmaps through tile overlay. A tile overlay\nis a collection of image tiles that can be displayed on top of Google Maps. Each\nimage tile is 256 x 256 pixels.\n\nThe tile overlay is a grid assembled from a collection of tiles, each assigned\n(`X`,`Y`) coordinates. The tile with coordinates (0,0) is always at the\nnorthwest corner of the map. The `X` values increase from west to east, while\nthe `Y` values increase from north to south.\n\nThe `zoom level` determines how large or small the contents of a map appear in a\nmap view. The tile grid size is determined by scaling the `X` and `Y`\ncoordinates exponentially by the zoom level. \n\n```text\ngridSizeX = XzoomLevel\ngridSizeY = YzoomLevel\n```\n\nFor example, at a zoom level of 2, the world map is represented using a 4 x 4\nmatrix, for a total of 16 tiles.\n\nThe following image shows a `TREE_UPI` heatmap of the entire world, sectioned\ninto tiles that can be accessed at a zoom level of 2.\n\nSee [Map and Tile\ncoordinates](/maps/documentation/javascript/coordinates#tile-coordinates) for\nadditional details.\n\nYou can request current pollen heatmap tiles using the [heatmapTiles](/maps/documentation/pollen/reference/rest/v1/mapTypes.heatmapTiles/lookupHeatmapTile)\nendpoint by sending an HTTP GET request to: \n\n```html\nhttps://pollen.googleapis.com/v1/mapTypes/TYPE/heatmapTiles/Z/X/Y?key=YOUR_API_KEY\n```\n\nAbout the heatmap endpoint\n--------------------------\n\nAll parameters listed below are required for a successful request:\n\n- `KEY`: Your application's API key. This key identifies your application for purposes of quota management. Learn how to [get a\n key](/maps/documentation/pollen/get-api-key).\n- `TYPE`: The type of heatmap to return. See [allowed\n values](/maps/documentation/pollen/reference/rest/v1/mapTypes.heatmapTiles/lookupHeatmapTile#maptype).\n- `Z`: Zoom level that determines how large or small the contents of a map appear in a map view. Allowed values are 0-16, where a value of 0 displays the entire world in a single tile.\n- `X`,`Y`: The tile coordinates relatively to the north east corner (0,0). `X` values increase from west to east and `Y` values increase from north to south. Coordinates must be valid for the specified zoom level. For example, if you set the zoom level to 2 and request a tile at coordinates (10,10), the API returns an error.\n\nExample heatmap request\n-----------------------\n\nThe image above shows a `TREE_UPI` heatmap with a zoom level of 2, along with\nthe coordinates of each tile. The following example uses the `heatmapTiles`\nendpoint to request the tile at coordinates (2,1): \n\n```html\nhttps://pollen.googleapis.com/v1/mapTypes/TREE_UPI/heatmapTiles/2/2/1?key=YOUR_API_KEY\n```\n\nThe tile appears as an image that can be overlaid on a map:\n\nFor more information on overlaying tiles on top of the default map, see\n[Overlay Map Types](/maps/documentation/javascript/examples/maptype-overlay)."]]