แผนที่ความหนาแน่น
จัดทุกอย่างให้เป็นระเบียบอยู่เสมอด้วยคอลเล็กชัน
บันทึกและจัดหมวดหมู่เนื้อหาตามค่ากำหนดของคุณ
ปลายทาง
heatmapTiles
จะแสดงแผนที่ความหนาแน่นที่เกี่ยวข้องกับละอองเกสรผ่านการวางซ้อนไทล์ การวางซ้อนของชิ้นส่วนภาพ
คือชุดของชิ้นส่วนภาพที่แสดงบน Google Maps ได้ ไทล์รูปภาพแต่ละรายการมีขนาด 256 x 256 พิกเซล
การวางซ้อนของแผนที่ย่อยคือตารางกริดที่ประกอบขึ้นจากคอลเล็กชันของแผนที่ย่อย โดยแต่ละแผนที่ย่อยจะได้รับพิกัด (X
,Y
) ไทล์ที่มีพิกัด (0,0) จะอยู่ที่มุม
ตะวันตกเฉียงเหนือของแผนที่เสมอ ค่า X
จะเพิ่มขึ้นจากตะวันตกไปตะวันออก ส่วนค่า Y
จะเพิ่มขึ้นจากเหนือไปใต้
zoom level
จะกำหนดว่าเนื้อหาของแผนที่จะปรากฏในมุมมองแผนที่
มีขนาดใหญ่หรือเล็กเพียงใด ขนาดตารางกริดของไทล์จะกำหนดโดยการปรับขนาดพิกัด X
และ Y
แบบยกกำลังตามระดับการซูม
gridSizeX = XzoomLevel
gridSizeY = YzoomLevel
ตัวอย่างเช่น ที่ระดับการซูม 2 แผนที่โลกจะแสดงโดยใช้เมทริกซ์ 4 x 4
ซึ่งมีไทล์ทั้งหมด 16 รายการ
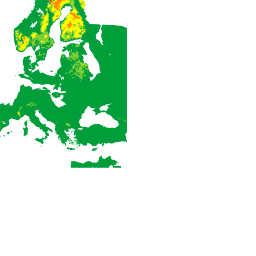
รูปภาพต่อไปนี้แสดงTREE_UPI
ฮีตแมปของทั้งโลก ซึ่งแบ่งออกเป็นไทล์ที่เข้าถึงได้ที่ระดับการซูม 2

ดูรายละเอียดเพิ่มเติมได้ที่พิกัดแผนที่และไทล์
คุณขอไทล์แผนที่ความร้อนของละอองเกสรปัจจุบันได้โดยใช้ปลายทาง
heatmapTiles
โดยส่งคำขอ HTTP GET ไปยัง
https://pollen.googleapis.com/v1/mapTypes/TYPE/heatmapTiles/Z/X/Y?key=YOUR_API_KEY
เกี่ยวกับปลายทางแผนที่ความหนาแน่น
ต้องระบุพารามิเตอร์ทั้งหมดที่แสดงด้านล่างเพื่อให้คำขอสำเร็จ
KEY
: คีย์ API ของแอปพลิเคชัน คีย์นี้จะระบุแอปพลิเคชันของคุณเพื่อ
วัตถุประสงค์ในการจัดการโควต้า ดูวิธีรับ
คีย์
TYPE
: ประเภทของฮีตแมปที่จะแสดง ดูค่าที่อนุญาต
Z
: ระดับการซูมที่กำหนดว่าเนื้อหาของแผนที่จะปรากฏในมุมมองแผนที่ใหญ่หรือเล็กเพียงใด ค่าที่ใช้ได้คือ 0-16 โดยค่า 0 จะแสดงทั้งโลกในไทล์เดียว
X
,Y
: พิกัดไทล์ที่สัมพันธ์กับมุมบนซ้าย (0,0) X
ค่าจะเพิ่มขึ้นจากตะวันตกไปตะวันออก และค่า Y
จะเพิ่มขึ้นจากเหนือไป
ใต้ พิกัดต้องถูกต้องสำหรับระดับการซูมที่ระบุ เช่น หากคุณตั้งค่าระดับการซูมเป็น 2 และขอไทล์ที่พิกัด (10,10)
API จะแสดงข้อผิดพลาด
ตัวอย่างคำขอแผนที่ความหนาแน่น
รูปภาพด้านบนแสดงTREE_UPI
ฮีตแมปที่มีระดับการซูม 2 พร้อมด้วย
พิกัดของไทล์แต่ละรายการ ตัวอย่างต่อไปนี้ใช้heatmapTiles
ปลายทางเพื่อขอไทล์ที่พิกัด (2,1)
https://pollen.googleapis.com/v1/mapTypes/TREE_UPI/heatmapTiles/2/2/1?key=YOUR_API_KEY
ไทล์จะปรากฏเป็นรูปภาพที่ซ้อนทับบนแผนที่ได้

ดูข้อมูลเพิ่มเติมเกี่ยวกับการวางซ้อนไทล์บนแผนที่เริ่มต้นได้ที่
ประเภทแผนที่ซ้อนทับ
เนื้อหาของหน้าเว็บนี้ได้รับอนุญาตภายใต้ใบอนุญาตที่ต้องระบุที่มาของครีเอทีฟคอมมอนส์ 4.0 และตัวอย่างโค้ดได้รับอนุญาตภายใต้ใบอนุญาต Apache 2.0 เว้นแต่จะระบุไว้เป็นอย่างอื่น โปรดดูรายละเอียดที่นโยบายเว็บไซต์ Google Developers Java เป็นเครื่องหมายการค้าจดทะเบียนของ Oracle และ/หรือบริษัทในเครือ
อัปเดตล่าสุด 2025-08-31 UTC
[null,null,["อัปเดตล่าสุด 2025-08-31 UTC"],[[["\u003cp\u003eThe heatmapTiles endpoint delivers pollen heatmaps as tile overlays, which are collections of 256x256 pixel image tiles displayed on top of Google Maps.\u003c/p\u003e\n"],["\u003cp\u003eTile coordinates (X,Y) determine the grid position, with (0,0) at the northwest corner and increasing values eastward for X and southward for Y.\u003c/p\u003e\n"],["\u003cp\u003eZoom level (Z) controls map content size and grid dimensions, ranging from 0 (entire world) to 16, influencing tile coordinates validity.\u003c/p\u003e\n"],["\u003cp\u003eTo request heatmap tiles, use the heatmapTiles endpoint with required parameters: API key, heatmap type, zoom level, and tile coordinates (X,Y).\u003c/p\u003e\n"],["\u003cp\u003eYou can overlay these pollen heatmap tiles onto existing maps for visualization, enhancing applications with pollen information.\u003c/p\u003e\n"]]],["The `heatmapTiles` endpoint provides pollen heatmaps as image tiles (256x256 pixels) overlaid on Google Maps. Tiles are arranged in a grid with (X,Y) coordinates, starting from (0,0) in the northwest. The zoom level (0-16) dictates map detail, scaling the grid exponentially (gridSizeX = X^zoomLevel). A request to the endpoint requires an API key, heatmap `TYPE`, `Z` zoom level, and `X`, `Y` tile coordinates. The format for a request is: `https://pollen.googleapis.com/v1/mapTypes/TYPE/heatmapTiles/Z/X/Y?key=YOUR_API_KEY`\n"],null,["# Heatmaps\n\nThe\n[heatmapTiles](/maps/documentation/pollen/reference/rest/v1/mapTypes.heatmapTiles/lookupHeatmapTile)\nendpoint provides pollen-related heatmaps through tile overlay. A tile overlay\nis a collection of image tiles that can be displayed on top of Google Maps. Each\nimage tile is 256 x 256 pixels.\n\nThe tile overlay is a grid assembled from a collection of tiles, each assigned\n(`X`,`Y`) coordinates. The tile with coordinates (0,0) is always at the\nnorthwest corner of the map. The `X` values increase from west to east, while\nthe `Y` values increase from north to south.\n\nThe `zoom level` determines how large or small the contents of a map appear in a\nmap view. The tile grid size is determined by scaling the `X` and `Y`\ncoordinates exponentially by the zoom level. \n\n```text\ngridSizeX = XzoomLevel\ngridSizeY = YzoomLevel\n```\n\nFor example, at a zoom level of 2, the world map is represented using a 4 x 4\nmatrix, for a total of 16 tiles.\n\nThe following image shows a `TREE_UPI` heatmap of the entire world, sectioned\ninto tiles that can be accessed at a zoom level of 2.\n\nSee [Map and Tile\ncoordinates](/maps/documentation/javascript/coordinates#tile-coordinates) for\nadditional details.\n\nYou can request current pollen heatmap tiles using the [heatmapTiles](/maps/documentation/pollen/reference/rest/v1/mapTypes.heatmapTiles/lookupHeatmapTile)\nendpoint by sending an HTTP GET request to: \n\n```html\nhttps://pollen.googleapis.com/v1/mapTypes/TYPE/heatmapTiles/Z/X/Y?key=YOUR_API_KEY\n```\n\nAbout the heatmap endpoint\n--------------------------\n\nAll parameters listed below are required for a successful request:\n\n- `KEY`: Your application's API key. This key identifies your application for purposes of quota management. Learn how to [get a\n key](/maps/documentation/pollen/get-api-key).\n- `TYPE`: The type of heatmap to return. See [allowed\n values](/maps/documentation/pollen/reference/rest/v1/mapTypes.heatmapTiles/lookupHeatmapTile#maptype).\n- `Z`: Zoom level that determines how large or small the contents of a map appear in a map view. Allowed values are 0-16, where a value of 0 displays the entire world in a single tile.\n- `X`,`Y`: The tile coordinates relatively to the north east corner (0,0). `X` values increase from west to east and `Y` values increase from north to south. Coordinates must be valid for the specified zoom level. For example, if you set the zoom level to 2 and request a tile at coordinates (10,10), the API returns an error.\n\nExample heatmap request\n-----------------------\n\nThe image above shows a `TREE_UPI` heatmap with a zoom level of 2, along with\nthe coordinates of each tile. The following example uses the `heatmapTiles`\nendpoint to request the tile at coordinates (2,1): \n\n```html\nhttps://pollen.googleapis.com/v1/mapTypes/TREE_UPI/heatmapTiles/2/2/1?key=YOUR_API_KEY\n```\n\nThe tile appears as an image that can be overlaid on a map:\n\nFor more information on overlaying tiles on top of the default map, see\n[Overlay Map Types](/maps/documentation/javascript/examples/maptype-overlay)."]]