熱視圖
透過集合功能整理內容
你可以依據偏好儲存及分類內容。
heatmapTiles 端點會透過圖塊疊加提供花粉相關熱視圖。圖塊疊加層是一組可顯示在 Google 地圖上方的圖像圖塊。每個圖片圖塊都是 256 x 256 像素。
圖塊疊加層是由一組圖塊組成的格線,每個圖塊都已指派 (X
,Y
) 座標。座標為 (0,0) 的圖塊一律位於地圖的西北角。X
值會由西到東遞增,Y
值則由北到南遞增。
zoom level
可決定地圖內容在地圖檢視畫面中的大小。圖塊格線大小取決於將 X
和 Y
座標依縮放等級指數縮放。
gridSizeX = XzoomLevel
gridSizeY = YzoomLevel
舉例來說,縮放等級為 2 時,世界地圖會以 4 x 4 矩陣表示,總共 16 個圖塊。
下圖顯示全球的 TREE_UPI
熱度圖,並分成多個圖塊,可在縮放等級 2 時存取。

詳情請參閱「地圖與圖塊座標」。
您可以將 HTTP GET 要求傳送至下列網址,使用
heatmapTiles 端點要求目前的 pollen 熱度圖圖塊:
https://pollen.googleapis.com/v1/mapTypes/TYPE/heatmapTiles/Z/X/Y?key=YOUR_API_KEY
關於熱視圖端點
如要成功提出要求,必須提供下列所有參數:
KEY
:應用程式的 API 金鑰。這個金鑰會識別您的應用程式,以利配額管理。瞭解如何取得金鑰。
TYPE
:要傳回的熱視圖類型。請參閱允許的值。
Z
:縮放等級,決定地圖檢視畫面中地圖內容的大小。有效值為 0 至 16,其中值為 0 時,整個世界會顯示在單一圖塊中。
X
、Y
:相對於東北角 (0,0) 的圖塊座標。X
值會從西到東遞增,Y
值則從北到南遞增。座標必須適用於指定的縮放等級。舉例來說,如果您將縮放等級設為 2,並要求座標 (10,10) 的圖塊,API 會傳回錯誤。
熱視圖要求範例
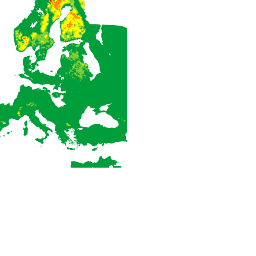
上圖顯示縮放等級為 2 的 TREE_UPI
熱視圖,以及每個圖塊的座標。下列範例使用 heatmapTiles
端點,要求座標 (2,1) 的圖塊:
https://pollen.googleapis.com/v1/mapTypes/TREE_UPI/heatmapTiles/2/2/1?key=YOUR_API_KEY
圖塊會顯示為可疊加在地圖上的圖片:

如要進一步瞭解如何在預設地圖上疊加圖塊,請參閱「疊加層地圖類型」。
除非另有註明,否則本頁面中的內容是採用創用 CC 姓名標示 4.0 授權,程式碼範例則為阿帕契 2.0 授權。詳情請參閱《Google Developers 網站政策》。Java 是 Oracle 和/或其關聯企業的註冊商標。
上次更新時間:2025-08-31 (世界標準時間)。
[null,null,["上次更新時間:2025-08-31 (世界標準時間)。"],[[["\u003cp\u003eThe heatmapTiles endpoint delivers pollen heatmaps as tile overlays, which are collections of 256x256 pixel image tiles displayed on top of Google Maps.\u003c/p\u003e\n"],["\u003cp\u003eTile coordinates (X,Y) determine the grid position, with (0,0) at the northwest corner and increasing values eastward for X and southward for Y.\u003c/p\u003e\n"],["\u003cp\u003eZoom level (Z) controls map content size and grid dimensions, ranging from 0 (entire world) to 16, influencing tile coordinates validity.\u003c/p\u003e\n"],["\u003cp\u003eTo request heatmap tiles, use the heatmapTiles endpoint with required parameters: API key, heatmap type, zoom level, and tile coordinates (X,Y).\u003c/p\u003e\n"],["\u003cp\u003eYou can overlay these pollen heatmap tiles onto existing maps for visualization, enhancing applications with pollen information.\u003c/p\u003e\n"]]],["The `heatmapTiles` endpoint provides pollen heatmaps as image tiles (256x256 pixels) overlaid on Google Maps. Tiles are arranged in a grid with (X,Y) coordinates, starting from (0,0) in the northwest. The zoom level (0-16) dictates map detail, scaling the grid exponentially (gridSizeX = X^zoomLevel). A request to the endpoint requires an API key, heatmap `TYPE`, `Z` zoom level, and `X`, `Y` tile coordinates. The format for a request is: `https://pollen.googleapis.com/v1/mapTypes/TYPE/heatmapTiles/Z/X/Y?key=YOUR_API_KEY`\n"],null,["# Heatmaps\n\nThe\n[heatmapTiles](/maps/documentation/pollen/reference/rest/v1/mapTypes.heatmapTiles/lookupHeatmapTile)\nendpoint provides pollen-related heatmaps through tile overlay. A tile overlay\nis a collection of image tiles that can be displayed on top of Google Maps. Each\nimage tile is 256 x 256 pixels.\n\nThe tile overlay is a grid assembled from a collection of tiles, each assigned\n(`X`,`Y`) coordinates. The tile with coordinates (0,0) is always at the\nnorthwest corner of the map. The `X` values increase from west to east, while\nthe `Y` values increase from north to south.\n\nThe `zoom level` determines how large or small the contents of a map appear in a\nmap view. The tile grid size is determined by scaling the `X` and `Y`\ncoordinates exponentially by the zoom level. \n\n```text\ngridSizeX = XzoomLevel\ngridSizeY = YzoomLevel\n```\n\nFor example, at a zoom level of 2, the world map is represented using a 4 x 4\nmatrix, for a total of 16 tiles.\n\nThe following image shows a `TREE_UPI` heatmap of the entire world, sectioned\ninto tiles that can be accessed at a zoom level of 2.\n\nSee [Map and Tile\ncoordinates](/maps/documentation/javascript/coordinates#tile-coordinates) for\nadditional details.\n\nYou can request current pollen heatmap tiles using the [heatmapTiles](/maps/documentation/pollen/reference/rest/v1/mapTypes.heatmapTiles/lookupHeatmapTile)\nendpoint by sending an HTTP GET request to: \n\n```html\nhttps://pollen.googleapis.com/v1/mapTypes/TYPE/heatmapTiles/Z/X/Y?key=YOUR_API_KEY\n```\n\nAbout the heatmap endpoint\n--------------------------\n\nAll parameters listed below are required for a successful request:\n\n- `KEY`: Your application's API key. This key identifies your application for purposes of quota management. Learn how to [get a\n key](/maps/documentation/pollen/get-api-key).\n- `TYPE`: The type of heatmap to return. See [allowed\n values](/maps/documentation/pollen/reference/rest/v1/mapTypes.heatmapTiles/lookupHeatmapTile#maptype).\n- `Z`: Zoom level that determines how large or small the contents of a map appear in a map view. Allowed values are 0-16, where a value of 0 displays the entire world in a single tile.\n- `X`,`Y`: The tile coordinates relatively to the north east corner (0,0). `X` values increase from west to east and `Y` values increase from north to south. Coordinates must be valid for the specified zoom level. For example, if you set the zoom level to 2 and request a tile at coordinates (10,10), the API returns an error.\n\nExample heatmap request\n-----------------------\n\nThe image above shows a `TREE_UPI` heatmap with a zoom level of 2, along with\nthe coordinates of each tile. The following example uses the `heatmapTiles`\nendpoint to request the tile at coordinates (2,1): \n\n```html\nhttps://pollen.googleapis.com/v1/mapTypes/TREE_UPI/heatmapTiles/2/2/1?key=YOUR_API_KEY\n```\n\nThe tile appears as an image that can be overlaid on a map:\n\nFor more information on overlaying tiles on top of the default map, see\n[Overlay Map Types](/maps/documentation/javascript/examples/maptype-overlay)."]]