Pollen API の概要
コレクションでコンテンツを整理
必要に応じて、コンテンツの保存と分類を行います。

Pollen API を使用すると、特定の場所の花粉に関するデータをリクエストできます。花粉データには、地域の植物種や花粉の種類、花粉飛散量指数、健康に関する推奨事項が含まれます。1 Pollen API は 65 を超える国に対応しており、解像度は 1 × 1 km(0.6 × 0.6 マイル)です。
この API は、次のものをクエリできるエンドポイントを提供します。
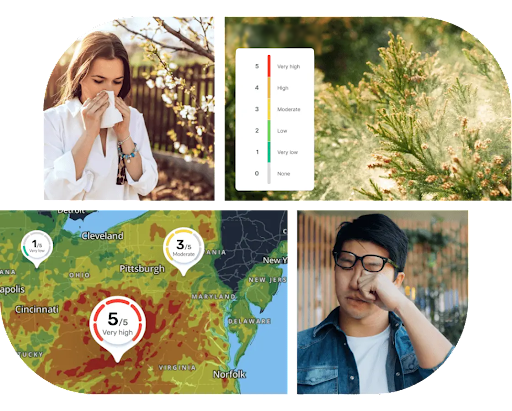
Pollen API の機能
日別の花粉飛散量指数とカテゴリ: Pollen API は、さまざまな花粉の種類と植物の指数の値を 1 × 1 km(0.6 × 0.6 マイル)の解像度で継続的に計算します。
健康に関する推奨事項: 現在の花粉飛散量に応じた健康に関する推奨事項。健康に関する推奨事項は、花粉指数レベルに応じて植物の種類レベルで実装されます。[^1]
植物の説明の詳細: 植物に関連するさまざまな種と、アレルギー反応を引き起こす可能性に関する詳細情報。説明には、種類、分類、季節、特殊な形状、特殊な色、交差反応、各植物の写真 2 枚などの情報が含まれます。
ヒートマップ: Google マップ上に表示できる、花粉の種類別飛散量指数の画像タイルのコレクション。
Pollen API の対象国と地域
花粉と植物の情報が利用可能な国別の最新のサポート範囲については、Pollen API の対象国と植物をご覧ください。
Pollen API の使用方法
次のステップ
特に記載のない限り、このページのコンテンツはクリエイティブ・コモンズの表示 4.0 ライセンスにより使用許諾されます。コードサンプルは Apache 2.0 ライセンスにより使用許諾されます。詳しくは、Google Developers サイトのポリシーをご覧ください。Java は Oracle および関連会社の登録商標です。
最終更新日 2025-08-31 UTC。
[null,null,["最終更新日 2025-08-31 UTC。"],[[["\u003cp\u003eThe Pollen API delivers location-specific pollen data, including pollen types, plant species, pollen index, and health recommendations for over 65 countries.\u003c/p\u003e\n"],["\u003cp\u003eThis API offers endpoints for accessing daily pollen forecasts (up to 5 days) and visualizing pollen distribution with heatmaps.\u003c/p\u003e\n"],["\u003cp\u003eFeatures include a daily pollen index, categorized by plant type, health recommendations based on pollen levels, detailed plant descriptions, and heatmaps for visualizing pollen distribution.\u003c/p\u003e\n"],["\u003cp\u003eYou can access daily pollen forecast data and heatmap tiles through dedicated endpoints after setting up your Google Cloud project.\u003c/p\u003e\n"]]],[],null,["# Pollen API Overview\n\nThe Pollen API lets you request pollen data for a specific location.\nPollen data includes regional plant species and pollen types, as well as pollen\nindex and health recommendations.^[1](#fn1)^ The Pollen API covers over 65 countries\nwith a resolution of 1 x 1 kilometer (0.6 x 0.6 mile).\n\nThe API provides endpoints that let you query:\n\n- **Forecast:** Up to 5-day pollen forecast with daily information, including\n pollen index for types of plants.^[2](#fn2)^\n\n- **Heatmaps:** Color-coded tiles of 3 pollen types.\n\nFeatures of the Pollen API\n--------------------------\n\n- **Daily forecast pollen index and categories:** The Pollen API\n continuously calculates the value of various pollen types and plant indices\n with 1 x 1 kilometer (0.6 x 0.6 mile) resolution.\n\n- **Health recommendations:** Recommended health insights according to the\n current pollen levels. Health recommendations are implemented at the plant\n type level according to the pollen index level.\\[\\^1\\]\n\n- **Plant description details:** Detailed information for the various species\n that relate to the plant and its potential for allergenic effect. The\n description includes the following information: type, family, season,\n special shapes, special colors, cross reaction, and 2 pictures of each\n plant.\n\n- **Heatmaps:** A collection of pollen type index image tiles that can be\n displayed on top of Google Maps.\n\n### Pollen API country and region coverage\n\nSee [Pollen API supported countries and plants](/maps/documentation/pollen/coverage) for\nthe latest coverage details, on a country-by-country basis, for which pollen and\nplant information is available.\n\nHow to use the Pollen API\n-------------------------\n\n|---|-------------------------------------------|----------------------------------------------------------------------------------------------------------------------------------|\n| 1 | **Get set up** | Start with [Set up your Google Cloud project](/maps/documentation/pollen/cloud-setup) and complete the instructions that follow. |\n| 2 | **Get daily pollen forecast information** | See [Get forecast](/maps/documentation/pollen/forecast). |\n| 3 | **Get heatmap tiles** | See [Get heatmap tiles](/maps/documentation/pollen/heatmap-tiles). |\n\nWhat's next\n-----------\n\n- [Set up your Google Cloud project](/maps/documentation/pollen/cloud-setup)\n- [Get forecast](/maps/documentation/pollen/forecast)\n- [Get heatmap tiles](/maps/documentation/pollen/heatmap-tiles)\n\n*** ** * ** ***\n\n1.\n | **Note:** The [World Health Organization](https://iris.who.int/bitstream/handle/10665/345329/9789240034228-eng.pdf) and other regional authoritative sources identify AQI categories (color and range) for sensitive populations. Our Air Quality and Pollen APIs provide data and recommendations based on those sources. We do not process health data or personalize for end users.\n2. The number of forecast days may vary between locations and plant species. [↩](#fnref2)"]]