Omówienie interfejsu Pollen API
Zadbaj o dobrą organizację dzięki kolekcji
Zapisuj i kategoryzuj treści zgodnie ze swoimi preferencjami.

Interfejs Pollen API umożliwia wysyłanie zapytań o dane dotyczące pyłków w określonej lokalizacji.
Dane o pyłkach obejmują regionalne gatunki roślin i rodzaje pyłków, a także indeks pyłków i zalecenia dotyczące zdrowia.1 Interfejs Pollen API obejmuje ponad 65 krajów i ma rozdzielczość 1 x 1 km.
Interfejs API udostępnia punkty końcowe, które umożliwiają wysyłanie zapytań o:
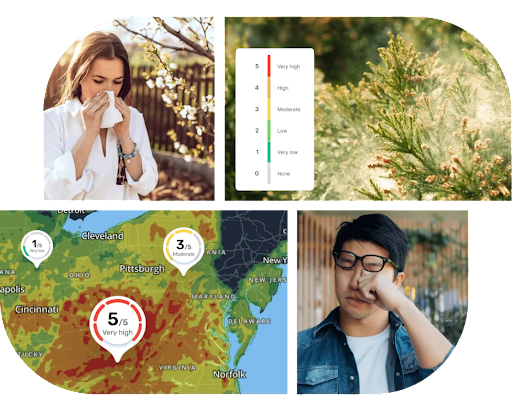
Prognoza: prognoza stężenia pyłków na maksymalnie 5 dni z codziennymi informacjami, w tym indeksem pyłków dla różnych rodzajów roślin.2
Mapy termiczne: kolorowe kafelki z 3 rodzajami pyłków.
Funkcje interfejsu Pollen API
Dzienna prognoza indeksu i kategorii pylenia: interfejs Pollen API stale oblicza wartość różnych rodzajów pyłków i indeksów roślin w rozdzielczości 1 x 1 km.
Rekomendacje dotyczące zdrowia: rekomendowane informacje o zdrowiu na podstawie aktualnego poziomu pyłków. Zalecenia dotyczące zdrowia są wdrażane na poziomie typu rośliny zgodnie z poziomem indeksu pyłków.[^1]
Szczegóły opisu rośliny: szczegółowe informacje o różnych gatunkach
związanych z rośliną i jej potencjalnym działaniem alergicznym. Opis zawiera następujące informacje: typ, rodzina, sezon, specjalne kształty, specjalne kolory, reakcja krzyżowa i 2 zdjęcia każdej rośliny.
Mapy cieplne: zbiór kafelków obrazów indeksu typu pyłku, które można wyświetlać na mapach Google.
Kraje i regiony objęte interfejsem Pollen API
Najnowsze informacje o zasięgu, w tym o krajach, w których dostępne są dane o pyłkach i roślinach, znajdziesz na stronie Obsługiwane kraje i rośliny w interfejsie Pollen API.
Jak korzystać z interfejsu Pollen API
Co dalej?
O ile nie stwierdzono inaczej, treść tej strony jest objęta licencją Creative Commons – uznanie autorstwa 4.0, a fragmenty kodu są dostępne na licencji Apache 2.0. Szczegółowe informacje na ten temat zawierają zasady dotyczące witryny Google Developers. Java jest zastrzeżonym znakiem towarowym firmy Oracle i jej podmiotów stowarzyszonych.
Ostatnia aktualizacja: 2025-08-31 UTC.
[null,null,["Ostatnia aktualizacja: 2025-08-31 UTC."],[[["\u003cp\u003eThe Pollen API delivers location-specific pollen data, including pollen types, plant species, pollen index, and health recommendations for over 65 countries.\u003c/p\u003e\n"],["\u003cp\u003eThis API offers endpoints for accessing daily pollen forecasts (up to 5 days) and visualizing pollen distribution with heatmaps.\u003c/p\u003e\n"],["\u003cp\u003eFeatures include a daily pollen index, categorized by plant type, health recommendations based on pollen levels, detailed plant descriptions, and heatmaps for visualizing pollen distribution.\u003c/p\u003e\n"],["\u003cp\u003eYou can access daily pollen forecast data and heatmap tiles through dedicated endpoints after setting up your Google Cloud project.\u003c/p\u003e\n"]]],[],null,["# Pollen API Overview\n\nThe Pollen API lets you request pollen data for a specific location.\nPollen data includes regional plant species and pollen types, as well as pollen\nindex and health recommendations.^[1](#fn1)^ The Pollen API covers over 65 countries\nwith a resolution of 1 x 1 kilometer (0.6 x 0.6 mile).\n\nThe API provides endpoints that let you query:\n\n- **Forecast:** Up to 5-day pollen forecast with daily information, including\n pollen index for types of plants.^[2](#fn2)^\n\n- **Heatmaps:** Color-coded tiles of 3 pollen types.\n\nFeatures of the Pollen API\n--------------------------\n\n- **Daily forecast pollen index and categories:** The Pollen API\n continuously calculates the value of various pollen types and plant indices\n with 1 x 1 kilometer (0.6 x 0.6 mile) resolution.\n\n- **Health recommendations:** Recommended health insights according to the\n current pollen levels. Health recommendations are implemented at the plant\n type level according to the pollen index level.\\[\\^1\\]\n\n- **Plant description details:** Detailed information for the various species\n that relate to the plant and its potential for allergenic effect. The\n description includes the following information: type, family, season,\n special shapes, special colors, cross reaction, and 2 pictures of each\n plant.\n\n- **Heatmaps:** A collection of pollen type index image tiles that can be\n displayed on top of Google Maps.\n\n### Pollen API country and region coverage\n\nSee [Pollen API supported countries and plants](/maps/documentation/pollen/coverage) for\nthe latest coverage details, on a country-by-country basis, for which pollen and\nplant information is available.\n\nHow to use the Pollen API\n-------------------------\n\n|---|-------------------------------------------|----------------------------------------------------------------------------------------------------------------------------------|\n| 1 | **Get set up** | Start with [Set up your Google Cloud project](/maps/documentation/pollen/cloud-setup) and complete the instructions that follow. |\n| 2 | **Get daily pollen forecast information** | See [Get forecast](/maps/documentation/pollen/forecast). |\n| 3 | **Get heatmap tiles** | See [Get heatmap tiles](/maps/documentation/pollen/heatmap-tiles). |\n\nWhat's next\n-----------\n\n- [Set up your Google Cloud project](/maps/documentation/pollen/cloud-setup)\n- [Get forecast](/maps/documentation/pollen/forecast)\n- [Get heatmap tiles](/maps/documentation/pollen/heatmap-tiles)\n\n*** ** * ** ***\n\n1.\n | **Note:** The [World Health Organization](https://iris.who.int/bitstream/handle/10665/345329/9789240034228-eng.pdf) and other regional authoritative sources identify AQI categories (color and range) for sensitive populations. Our Air Quality and Pollen APIs provide data and recommendations based on those sources. We do not process health data or personalize for end users.\n2. The number of forecast days may vary between locations and plant species. [↩](#fnref2)"]]