Pollen API 개요
컬렉션을 사용해 정리하기
내 환경설정을 기준으로 콘텐츠를 저장하고 분류하세요.

Pollen API를 사용하면 특정 위치의 꽃가루 데이터를 요청할 수 있습니다.
꽃가루 데이터에는 지역 식물 종 및 꽃가루 유형, 꽃가루 지수, 건강 권장사항이 포함됩니다.1 꽃가루 API는 1x1km (0.6x0.6마일) 해상도로 65개 이상의 국가를 지원합니다.
이 API는 다음을 쿼리할 수 있는 엔드포인트를 제공합니다.
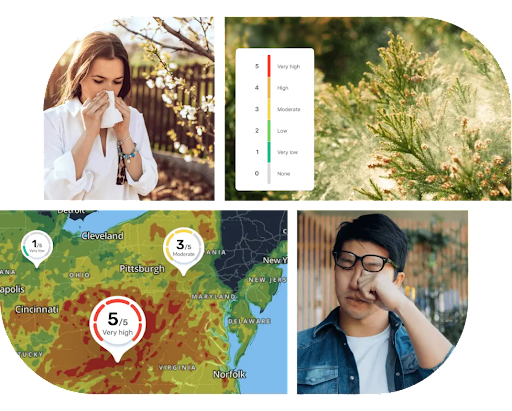
Pollen API의 기능
일일 예측 꽃가루 지수 및 카테고리: Pollen API는 해상도가 1x1km (0.6x0.6마일)인 다양한 꽃가루 유형과 식물 지수의 값을 지속적으로 계산합니다.
건강 관련 추천: 현재 꽃가루 수치에 따른 건강 관련 추천 통계입니다. 건강 추천은 꽃가루 지수 수준에 따라 식물 유형 수준에서 구현됩니다.[^1]
식물 설명 세부정보: 식물 및 알레르기 유발 가능성과 관련된 다양한 종에 관한 세부정보입니다. 설명에는 유형, 계열, 시즌, 특수 모양, 특수 색상, 교차 반응, 각 식물의 사진 2장이 포함됩니다.
히트맵: Google 지도 위에 표시할 수 있는 꽃가루 유형 지수 이미지 타일 모음입니다.
Pollen API 국가 및 지역 지원 범위
꽃가루 및 식물 정보를 사용할 수 있는 국가별 최신 사용 범위 세부정보는 꽃가루 API 지원 국가 및 식물을 참고하세요.
Pollen API 사용 방법
다음 단계
달리 명시되지 않는 한 이 페이지의 콘텐츠에는 Creative Commons Attribution 4.0 라이선스에 따라 라이선스가 부여되며, 코드 샘플에는 Apache 2.0 라이선스에 따라 라이선스가 부여됩니다. 자세한 내용은 Google Developers 사이트 정책을 참조하세요. 자바는 Oracle 및/또는 Oracle 계열사의 등록 상표입니다.
최종 업데이트: 2025-08-31(UTC)
[null,null,["최종 업데이트: 2025-08-31(UTC)"],[[["\u003cp\u003eThe Pollen API delivers location-specific pollen data, including pollen types, plant species, pollen index, and health recommendations for over 65 countries.\u003c/p\u003e\n"],["\u003cp\u003eThis API offers endpoints for accessing daily pollen forecasts (up to 5 days) and visualizing pollen distribution with heatmaps.\u003c/p\u003e\n"],["\u003cp\u003eFeatures include a daily pollen index, categorized by plant type, health recommendations based on pollen levels, detailed plant descriptions, and heatmaps for visualizing pollen distribution.\u003c/p\u003e\n"],["\u003cp\u003eYou can access daily pollen forecast data and heatmap tiles through dedicated endpoints after setting up your Google Cloud project.\u003c/p\u003e\n"]]],[],null,["# Pollen API Overview\n\nThe Pollen API lets you request pollen data for a specific location.\nPollen data includes regional plant species and pollen types, as well as pollen\nindex and health recommendations.^[1](#fn1)^ The Pollen API covers over 65 countries\nwith a resolution of 1 x 1 kilometer (0.6 x 0.6 mile).\n\nThe API provides endpoints that let you query:\n\n- **Forecast:** Up to 5-day pollen forecast with daily information, including\n pollen index for types of plants.^[2](#fn2)^\n\n- **Heatmaps:** Color-coded tiles of 3 pollen types.\n\nFeatures of the Pollen API\n--------------------------\n\n- **Daily forecast pollen index and categories:** The Pollen API\n continuously calculates the value of various pollen types and plant indices\n with 1 x 1 kilometer (0.6 x 0.6 mile) resolution.\n\n- **Health recommendations:** Recommended health insights according to the\n current pollen levels. Health recommendations are implemented at the plant\n type level according to the pollen index level.\\[\\^1\\]\n\n- **Plant description details:** Detailed information for the various species\n that relate to the plant and its potential for allergenic effect. The\n description includes the following information: type, family, season,\n special shapes, special colors, cross reaction, and 2 pictures of each\n plant.\n\n- **Heatmaps:** A collection of pollen type index image tiles that can be\n displayed on top of Google Maps.\n\n### Pollen API country and region coverage\n\nSee [Pollen API supported countries and plants](/maps/documentation/pollen/coverage) for\nthe latest coverage details, on a country-by-country basis, for which pollen and\nplant information is available.\n\nHow to use the Pollen API\n-------------------------\n\n|---|-------------------------------------------|----------------------------------------------------------------------------------------------------------------------------------|\n| 1 | **Get set up** | Start with [Set up your Google Cloud project](/maps/documentation/pollen/cloud-setup) and complete the instructions that follow. |\n| 2 | **Get daily pollen forecast information** | See [Get forecast](/maps/documentation/pollen/forecast). |\n| 3 | **Get heatmap tiles** | See [Get heatmap tiles](/maps/documentation/pollen/heatmap-tiles). |\n\nWhat's next\n-----------\n\n- [Set up your Google Cloud project](/maps/documentation/pollen/cloud-setup)\n- [Get forecast](/maps/documentation/pollen/forecast)\n- [Get heatmap tiles](/maps/documentation/pollen/heatmap-tiles)\n\n*** ** * ** ***\n\n1.\n | **Note:** The [World Health Organization](https://iris.who.int/bitstream/handle/10665/345329/9789240034228-eng.pdf) and other regional authoritative sources identify AQI categories (color and range) for sensitive populations. Our Air Quality and Pollen APIs provide data and recommendations based on those sources. We do not process health data or personalize for end users.\n2. The number of forecast days may vary between locations and plant species. [↩](#fnref2)"]]