סקירה כללית על אבקנים API
קל לארגן דפים בעזרת אוספים
אפשר לשמור ולסווג תוכן על סמך ההעדפות שלך.

באמצעות Pollen API אפשר לבקש נתונים על אבקנים במיקום ספציפי.
נתוני האבקנים כוללים מינים אזוריים של צמחים וסוגי אבקנים, וגם מדד אבקנים והמלצות בריאותיות.1 ממשק ה-API של האבקנים מכסה יותר מ-65 מדינות ברזולוציה של ק"מ אחד על ק"מ אחד.
ה-API מספק נקודות קצה שמאפשרות לשלוח שאילתות לגבי:
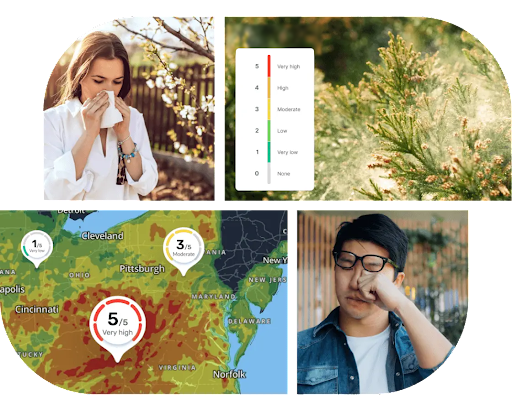
תחזית: תחזית אבקה ל-5 ימים עם מידע יומי, כולל מדד אבקה לסוגי צמחים.2
מפות חום: אריחים עם קידוד צבעים של 3 סוגי אבקנים.
תכונות של Pollen API
תחזית יומית של מדד האבקנים וקטגוריות: Pollen API מחשב באופן רציף את הערך של סוגים שונים של אבקנים ומדדי צמחים ברזולוציה של ק"מ אחד על ק"מ אחד.
המלצות בריאותיות: תובנות בריאותיות מומלצות בהתאם לרמות האבקנים הנוכחיות. ההמלצות בנושא בריאות מוטמעות ברמת סוג הצמח בהתאם לרמת מדד האבקנים.[^1]
פרטים על תיאור הצמח: מידע מפורט על המינים השונים שקשורים לצמח ועל הפוטנציאל שלו לגרום לתגובה אלרגית. התיאור כולל את המידע הבא: סוג, משפחה, עונה, צורות מיוחדות, צבעים מיוחדים, תגובה צולבת ו-2 תמונות של כל צמח.
מפות חום: אוסף של קטעי תמונות של אינדקס סוגי אבקנים שאפשר להציג מעל מפות Google.
כיסוי המדינות והאזורים של Pollen API
במאמר הזה מפורטות המדינות והצמחים שנתמכים ב-Pollen API. אפשר למצוא שם את פרטי הכיסוי העדכניים, לפי מדינה, שכוללים מידע על אבקנים וצמחים.
איך משתמשים ב-Pollen API
המאמרים הבאים
אלא אם צוין אחרת, התוכן של דף זה הוא ברישיון Creative Commons Attribution 4.0 ודוגמאות הקוד הן ברישיון Apache 2.0. לפרטים, ניתן לעיין במדיניות האתר Google Developers. Java הוא סימן מסחרי רשום של חברת Oracle ו/או של השותפים העצמאיים שלה.
עדכון אחרון: 2025-08-31 (שעון UTC).
[null,null,["עדכון אחרון: 2025-08-31 (שעון UTC)."],[[["\u003cp\u003eThe Pollen API delivers location-specific pollen data, including pollen types, plant species, pollen index, and health recommendations for over 65 countries.\u003c/p\u003e\n"],["\u003cp\u003eThis API offers endpoints for accessing daily pollen forecasts (up to 5 days) and visualizing pollen distribution with heatmaps.\u003c/p\u003e\n"],["\u003cp\u003eFeatures include a daily pollen index, categorized by plant type, health recommendations based on pollen levels, detailed plant descriptions, and heatmaps for visualizing pollen distribution.\u003c/p\u003e\n"],["\u003cp\u003eYou can access daily pollen forecast data and heatmap tiles through dedicated endpoints after setting up your Google Cloud project.\u003c/p\u003e\n"]]],[],null,["# Pollen API Overview\n\nThe Pollen API lets you request pollen data for a specific location.\nPollen data includes regional plant species and pollen types, as well as pollen\nindex and health recommendations.^[1](#fn1)^ The Pollen API covers over 65 countries\nwith a resolution of 1 x 1 kilometer (0.6 x 0.6 mile).\n\nThe API provides endpoints that let you query:\n\n- **Forecast:** Up to 5-day pollen forecast with daily information, including\n pollen index for types of plants.^[2](#fn2)^\n\n- **Heatmaps:** Color-coded tiles of 3 pollen types.\n\nFeatures of the Pollen API\n--------------------------\n\n- **Daily forecast pollen index and categories:** The Pollen API\n continuously calculates the value of various pollen types and plant indices\n with 1 x 1 kilometer (0.6 x 0.6 mile) resolution.\n\n- **Health recommendations:** Recommended health insights according to the\n current pollen levels. Health recommendations are implemented at the plant\n type level according to the pollen index level.\\[\\^1\\]\n\n- **Plant description details:** Detailed information for the various species\n that relate to the plant and its potential for allergenic effect. The\n description includes the following information: type, family, season,\n special shapes, special colors, cross reaction, and 2 pictures of each\n plant.\n\n- **Heatmaps:** A collection of pollen type index image tiles that can be\n displayed on top of Google Maps.\n\n### Pollen API country and region coverage\n\nSee [Pollen API supported countries and plants](/maps/documentation/pollen/coverage) for\nthe latest coverage details, on a country-by-country basis, for which pollen and\nplant information is available.\n\nHow to use the Pollen API\n-------------------------\n\n|---|-------------------------------------------|----------------------------------------------------------------------------------------------------------------------------------|\n| 1 | **Get set up** | Start with [Set up your Google Cloud project](/maps/documentation/pollen/cloud-setup) and complete the instructions that follow. |\n| 2 | **Get daily pollen forecast information** | See [Get forecast](/maps/documentation/pollen/forecast). |\n| 3 | **Get heatmap tiles** | See [Get heatmap tiles](/maps/documentation/pollen/heatmap-tiles). |\n\nWhat's next\n-----------\n\n- [Set up your Google Cloud project](/maps/documentation/pollen/cloud-setup)\n- [Get forecast](/maps/documentation/pollen/forecast)\n- [Get heatmap tiles](/maps/documentation/pollen/heatmap-tiles)\n\n*** ** * ** ***\n\n1.\n | **Note:** The [World Health Organization](https://iris.who.int/bitstream/handle/10665/345329/9789240034228-eng.pdf) and other regional authoritative sources identify AQI categories (color and range) for sensitive populations. Our Air Quality and Pollen APIs provide data and recommendations based on those sources. We do not process health data or personalize for end users.\n2. The number of forecast days may vary between locations and plant species. [↩](#fnref2)"]]