
借助 Pollen API,您可以请求特定位置的花粉数据。花粉数据包括区域植物物种和花粉类型,以及花粉指数和健康建议。1 花粉 API 覆盖 65 个以上的国家/地区,分辨率为 1 x 1 公里(0.6 x 0.6 英里)。
该 API 提供的端点可让您查询以下内容:
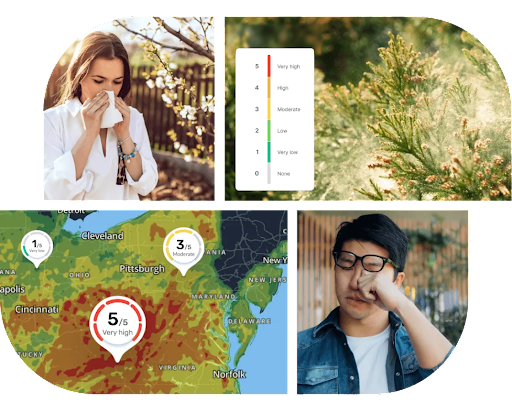
预报:最多 5 天的花粉预报,提供每日信息,包括各种植物的花粉指数。2
热图:3 种花粉类型的彩色编码方块。
Pollen API 的功能
每日花粉指数和类别预报:Pollen API 会以 1 x 1 公里(0.6 x 0.6 英里)的精细度持续计算各种花粉类型和植物指数的值。
健康建议:根据当前花粉浓度提供的健康建议。健康建议是根据花粉指数级别在植物类型级别上实施的。[^1]
植物说明详细信息:与植物及其潜在致敏效应相关的各种物种的详细信息。说明包含以下信息:类型、科、季节、特殊形状、特殊颜色、交叉反应,以及每种植物的 2 张图片。
热力图:一组可显示在 Google 地图顶部的花粉类型指数图片图块。
Pollen API 支持的国家/地区
如需按国家/地区查看花粉和植物信息的最新覆盖范围详细信息,请参阅支持花粉 API 的国家/地区和植物。
如何使用 Pollen API
| 1 | 开始设置 | 首先,请设置您的 Google Cloud 项目,然后按照后续说明操作。 |
| 2 | 获取每日花粉预报信息 | 请参阅获取预测数据。 |
| 3 | 获取热点图功能块 | 请参阅获取热图图块。 |
后续步骤
-
预报天数可能会因地点和植物种类而异。 ↩