Pollen API – Übersicht
Mit Sammlungen den Überblick behalten
Sie können Inhalte basierend auf Ihren Einstellungen speichern und kategorisieren.

Mit der Pollen API können Sie Pollendaten für einen bestimmten Standort anfordern.
Die Pollendaten umfassen regionale Pflanzen- und Pollenarten sowie den Pollenindex und Gesundheitsempfehlungen.1 Die Pollen API deckt über 65 Länder mit einer Auflösung von 1 × 1 km ab.
Die API bietet Endpunkte, mit denen Sie Folgendes abfragen können:
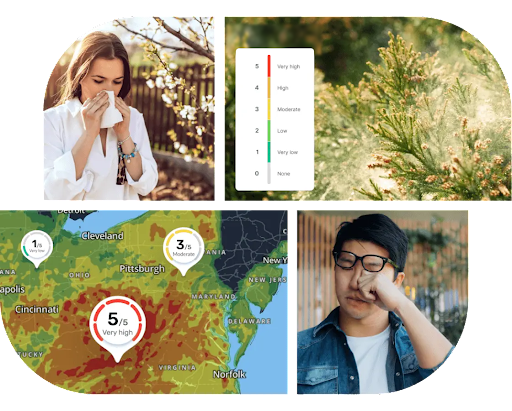
Vorhersage:Bis zu 5-Tage-Pollenflugvorhersage mit täglichen Informationen, einschließlich Pollenindex für Pflanzenarten.2
Heatmaps:Farbcodierte Kacheln für drei Pollenarten.
Funktionen der Pollen API
Tägliche Vorhersage von Pollenindex und ‑kategorien:Die Pollen API berechnet kontinuierlich den Wert verschiedener Pollenarten und Pflanzenindizes mit einer Auflösung von 1 × 1 km.
Gesundheitsempfehlungen:Empfohlene Gesundheitsinformationen basierend auf den aktuellen Pollenwerten. Gesundheitsempfehlungen werden auf der Ebene des Pflanzentyps entsprechend dem Pollenindex umgesetzt.[^1]
Details zur Pflanzenbeschreibung:Detaillierte Informationen zu den verschiedenen Arten, die sich auf die Pflanze und ihr allergenes Potenzial beziehen. Die Beschreibung enthält die folgenden Informationen: Typ, Familie, Saison, besondere Formen, besondere Farben, Kreuzreaktion und zwei Bilder jeder Pflanze.
Heatmaps:Eine Sammlung von Bildkacheln mit dem Pollentypindex, die über Google Maps angezeigt werden können.
Abdeckung der Pollen API nach Land und Region
Hier finden Sie die aktuellen Abdeckungsdetails für die einzelnen Länder, aus denen Pollen- und Pflanzeninformationen verfügbar sind.
Verwendung der Pollen API
Nächste Schritte
Sofern nicht anders angegeben, sind die Inhalte dieser Seite unter der Creative Commons Attribution 4.0 License und Codebeispiele unter der Apache 2.0 License lizenziert. Weitere Informationen finden Sie in den Websiterichtlinien von Google Developers. Java ist eine eingetragene Marke von Oracle und/oder seinen Partnern.
Zuletzt aktualisiert: 2025-08-31 (UTC).
[null,null,["Zuletzt aktualisiert: 2025-08-31 (UTC)."],[[["\u003cp\u003eThe Pollen API delivers location-specific pollen data, including pollen types, plant species, pollen index, and health recommendations for over 65 countries.\u003c/p\u003e\n"],["\u003cp\u003eThis API offers endpoints for accessing daily pollen forecasts (up to 5 days) and visualizing pollen distribution with heatmaps.\u003c/p\u003e\n"],["\u003cp\u003eFeatures include a daily pollen index, categorized by plant type, health recommendations based on pollen levels, detailed plant descriptions, and heatmaps for visualizing pollen distribution.\u003c/p\u003e\n"],["\u003cp\u003eYou can access daily pollen forecast data and heatmap tiles through dedicated endpoints after setting up your Google Cloud project.\u003c/p\u003e\n"]]],[],null,["# Pollen API Overview\n\nThe Pollen API lets you request pollen data for a specific location.\nPollen data includes regional plant species and pollen types, as well as pollen\nindex and health recommendations.^[1](#fn1)^ The Pollen API covers over 65 countries\nwith a resolution of 1 x 1 kilometer (0.6 x 0.6 mile).\n\nThe API provides endpoints that let you query:\n\n- **Forecast:** Up to 5-day pollen forecast with daily information, including\n pollen index for types of plants.^[2](#fn2)^\n\n- **Heatmaps:** Color-coded tiles of 3 pollen types.\n\nFeatures of the Pollen API\n--------------------------\n\n- **Daily forecast pollen index and categories:** The Pollen API\n continuously calculates the value of various pollen types and plant indices\n with 1 x 1 kilometer (0.6 x 0.6 mile) resolution.\n\n- **Health recommendations:** Recommended health insights according to the\n current pollen levels. Health recommendations are implemented at the plant\n type level according to the pollen index level.\\[\\^1\\]\n\n- **Plant description details:** Detailed information for the various species\n that relate to the plant and its potential for allergenic effect. The\n description includes the following information: type, family, season,\n special shapes, special colors, cross reaction, and 2 pictures of each\n plant.\n\n- **Heatmaps:** A collection of pollen type index image tiles that can be\n displayed on top of Google Maps.\n\n### Pollen API country and region coverage\n\nSee [Pollen API supported countries and plants](/maps/documentation/pollen/coverage) for\nthe latest coverage details, on a country-by-country basis, for which pollen and\nplant information is available.\n\nHow to use the Pollen API\n-------------------------\n\n|---|-------------------------------------------|----------------------------------------------------------------------------------------------------------------------------------|\n| 1 | **Get set up** | Start with [Set up your Google Cloud project](/maps/documentation/pollen/cloud-setup) and complete the instructions that follow. |\n| 2 | **Get daily pollen forecast information** | See [Get forecast](/maps/documentation/pollen/forecast). |\n| 3 | **Get heatmap tiles** | See [Get heatmap tiles](/maps/documentation/pollen/heatmap-tiles). |\n\nWhat's next\n-----------\n\n- [Set up your Google Cloud project](/maps/documentation/pollen/cloud-setup)\n- [Get forecast](/maps/documentation/pollen/forecast)\n- [Get heatmap tiles](/maps/documentation/pollen/heatmap-tiles)\n\n*** ** * ** ***\n\n1.\n | **Note:** The [World Health Organization](https://iris.who.int/bitstream/handle/10665/345329/9789240034228-eng.pdf) and other regional authoritative sources identify AQI categories (color and range) for sensitive populations. Our Air Quality and Pollen APIs provide data and recommendations based on those sources. We do not process health data or personalize for end users.\n2. The number of forecast days may vary between locations and plant species. [↩](#fnref2)"]]