花火指数
コレクションでコンテンツを整理
必要に応じて、コンテンツの保存と分類を行います。
ユニバーサル花粉指数(UPI)とは
ユニバーサル花粉指数(UPI)は、異なる地域の花粉飛散量を比較するための世界共通の指標として設計されています。この指数は、花粉症や花粉に敏感な人がさまざまな要因に基づいて花粉にさらされるリスクを評価するのに役立ちます。多層モデルに基づいており、植物ごとの濃度モデル、世界中で使用されているさまざまな地域の花粉指数(LPI)、さまざまな植物の花粉タイプの抗原性を考慮した花粉レベルのデータ表現であり、1 日あたりの花粉の数(個/m3)を予測します。
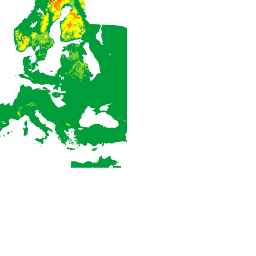
heatmapTiles エンドポイントは、ベースマップに重ね合わせることができるヒートマップ タイルを返します。ヒートマップ タイルには、特定の植物タイプ(TREE
、GRASS
、WEED
)の UPI が世界中で表示されます。
この指数は次の 6 つのカテゴリで構成されています。
値 |
色 |
説明 |
0 |
 |
なし |
1 |
 |
非常に少ない |
2 |
 |
低 |
3 |
 |
中 |
4 |
 |
高 |
5 |
 |
非常に高い |
各カテゴリは、特定の地域における花粉の濃度レベルと、通常経験するアレルギー症状の重症度への影響に基づいており、花粉レベルを包括的に表しています。UPI を統合することで、ユーザーはさまざまな場所の花粉の状況を比較して評価できます。
たとえば、次のヒートマップ タイルは、TREE
の花粉レベルが「非常に少ない」から「非常に多い」までの範囲であることを示しています。

対応植物
Pollen API は、草、雑草、木の 3 種類の植物をサポートしています。植物のデータは実際のデータソースの測定値とレポートに基づいており、Pollen API の植物データは地域によって異なる場合があります。
次のリストに、サポートされているプラントコードとそのメタデータを示します。
プラント コード |
表示名 |
タイプ |
ALDER |
Alder |
ツリー |
ASH |
アッシュ |
ツリー |
BIRCH |
シラカバ |
ツリー |
COTTONWOOD |
Cottonwood |
ツリー |
ELM |
Elm |
ツリー |
MAPLE |
Maple |
ツリー |
OLIVE |
オリーブ |
ツリー |
JUNIPER |
Juniper |
ツリー |
OAK |
オーク |
ツリー |
PINE |
Pine |
ツリー |
CYPRESS_PINE |
ヒノキ、マツ |
ツリー |
HAZEL |
Hazel |
ツリー |
GRAMINALES |
イネ科の植物 |
草 |
JAPANESE_CEDAR |
日本の杉 |
ツリー |
JAPANESE_CYPRESS |
ヒノキ |
ツリー |
RAGWEED |
ブタクサ |
雑草 |
MUGWORT |
ヨモギ |
雑草 |
特に記載のない限り、このページのコンテンツはクリエイティブ・コモンズの表示 4.0 ライセンスにより使用許諾されます。コードサンプルは Apache 2.0 ライセンスにより使用許諾されます。詳しくは、Google Developers サイトのポリシーをご覧ください。Java は Oracle および関連会社の登録商標です。
最終更新日 2025-08-31 UTC。
[null,null,["最終更新日 2025-08-31 UTC。"],[[["\u003cp\u003eThe Universal Pollen Index (UPI) provides a globally unified scale for comparing pollen levels, aiding in assessing pollen exposure risk.\u003c/p\u003e\n"],["\u003cp\u003eThe UPI utilizes a six-category system (None, Very Low, Low, Moderate, High, Very High) to represent pollen concentration and potential allergy symptom severity.\u003c/p\u003e\n"],["\u003cp\u003eHeatmap tiles visually display the UPI globally for three plant types: Tree, Grass, and Weed, allowing for easy comparison across locations.\u003c/p\u003e\n"],["\u003cp\u003eSupported plant types in the Pollen API include a variety of trees, grasses, and weeds, although availability may vary based on data source and location.\u003c/p\u003e\n"]]],["The Universal Pollen Index (UPI) is a global scale for comparing pollen levels, assessing pollen exposure risk. It utilizes a multilayer model, considering concentration per plant, local pollen indices, and allergenicity to predict pollen grains per cubic meter. The UPI ranges from 0 (None) to 5 (Very High), using heatmap tiles to visualize `TREE`, `GRASS`, or `WEED` pollen. The API supports various plant types, including `ALDER`, `OAK`, `GRAMINALES`, `RAGWEED`, and more.\n"],null,["# Pollen Index\n\nWhat is the Universal Pollen Index (UPI)?\n-----------------------------------------\n\nThe Universal Pollen Index (UPI) is designed to offer a globally unified scale\nfor comparing pollen levels across different areas. The index helps assess the\nrisk of pollen exposure based on various factors for people allergic or\nsensitive to pollen. Based on a multilayer model, it is a representation of\npollen level data that considers the concentration per plant model, many\ndifferent local pollen indices (LPI) used worldwide, and the allergenicity of\ndifferent plant pollen types to predict the number of pollen grains per cubic\nmeter (grains/m3) per day.\n\nThe heatmapTiles endpoint returns heatmap tiles that can be overlaid\non a basemap. Heatmap tiles display the UPI across the globe for a given plant\ntype (`TREE`, `GRASS`, or `WEED`).\n\nThe index consists of six categories:\n\n| Value | Color | Description |\n|-------|-------|-------------|\n| 0 | | None |\n| 1 | | Very Low |\n| 2 | | Low |\n| 3 | | Moderate |\n| 4 | | High |\n| 5 | | Very High |\n\nEach category is based on specific concentration levels of pollen in a\nparticular area and their effect on the severity of allergic symptoms that are\nusually experienced, providing a comprehensive representation of pollen levels.\nBy integrating the UPI, users can compare and assess pollen conditions in\nvarious locations.\n\nFor example, the following heatmap tile shows `TREE` pollen levels ranging from\n**Very Low** to **Very High**:\n\nSupported plants\n----------------\n\nThe Pollen API supports 3 different types of plants: **Grass** , **Weed** ,\nand **Tree**. Because a plant's availability is subject to actual data source\nmeasurements and reports, Pollen API plant data may vary across locations.\n\nThe following list shows supported plant codes and their metadata:\n\n| Plant Code | Display Name | Type |\n| `ALDER` | Alder | Tree |\n| `ASH` | Ash | Tree |\n| `BIRCH` | Birch | Tree |\n| `COTTONWOOD` | Cottonwood | Tree |\n| `ELM` | Elm | Tree |\n| `MAPLE` | Maple | Tree |\n| `OLIVE` | Olive | Tree |\n| `JUNIPER` | Juniper | Tree |\n| `OAK` | Oak | Tree |\n| `PINE` | Pine | Tree |\n| `CYPRESS_PINE` | Cypress pine | Tree |\n| `HAZEL` | Hazel | Tree |\n| `GRAMINALES` | Grasses | Grass |\n| `JAPANESE_CEDAR` | Japanese cedar | Tree |\n| `JAPANESE_CYPRESS` | Japanese cypress | Tree |\n| `RAGWEED` | Ragweed | Weed |\n| `MUGWORT` | Mugwort | Weed |\n|--------------------|------------------|-------|"]]