꽃가루 지수
컬렉션을 사용해 정리하기
내 환경설정을 기준으로 콘텐츠를 저장하고 분류하세요.
꽃가루 지수 (UPI)란 무엇인가요?
꽃가루 지수 (UPI)는 다양한 지역의 꽃가루 수치를 비교할 수 있는 전 세계적으로 통합된 단위를 제공하도록 설계되었습니다. 이 지수는 꽃가루에 알레르기가 있거나 민감한 사람들을 위해 다양한 요인을 기반으로 꽃가루 노출 위험을 평가하는 데 도움이 됩니다. 다층 모델을 기반으로 하며, 식물 모델당 농도, 전 세계에서 사용되는 다양한 지역 꽃가루 지수 (LPI), 다양한 식물 꽃가루 유형의 알레르기성을 고려하여 일일 입방미터당 꽃가루 수 (grains/m3)를 예측하는 꽃가루 수치 데이터의 표현입니다.
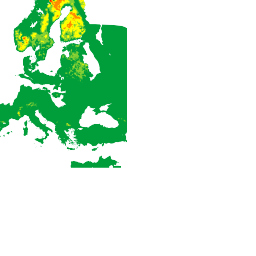
heatmapTiles 엔드포인트는 기본 지도에 오버레이할 수 있는 히트맵 타일을 반환합니다. 히트맵 타일은 지정된 식물 유형 (TREE
, GRASS
또는 WEED
)에 대한 전 세계 UPI를 표시합니다.
지수는 다음 6가지 카테고리로 구성됩니다.
값 |
색상 |
설명 |
0 |
 |
없음 |
1 |
 |
매우 부족 |
2 |
 |
낮음 |
3 |
 |
보통 |
4 |
 |
높음 |
5 |
 |
매우 높음 |
각 카테고리는 특정 지역의 꽃가루 농도와 일반적으로 경험하는 알레르기 증상의 심각도에 미치는 영향을 기반으로 하며, 꽃가루 수준을 포괄적으로 나타냅니다.
UPI를 통합하면 사용자가 다양한 지역의 꽃가루 상태를 비교하고 평가할 수 있습니다.
예를 들어 다음 히트맵 타일은 TREE
꽃가루 수치가 매우 낮음에서 매우 높음까지 다양함을 보여줍니다.

지원되는 식물
꽃가루 API는 잔디, 잡초, 나무의 세 가지 식물 유형을 지원합니다. 식물의 가용성은 실제 데이터 소스 측정 및 보고서에 따라 달라지므로 꽃가루 API 식물 데이터는 지역에 따라 다를 수 있습니다.
다음 목록에는 지원되는 공장 코드와 해당 메타데이터가 표시됩니다.
플랜트 코드 |
표시 이름 |
유형 |
ALDER |
Alder |
트리 |
ASH |
애쉬 그레이 |
트리 |
BIRCH |
자작나무 |
트리 |
COTTONWOOD |
Cottonwood |
트리 |
ELM |
Elm |
트리 |
MAPLE |
Maple |
트리 |
OLIVE |
Olive |
트리 |
JUNIPER |
Juniper |
트리 |
OAK |
오크 나무 |
트리 |
PINE |
소나무 |
트리 |
CYPRESS_PINE |
사이프러스 소나무 |
트리 |
HAZEL |
헤이즐 |
트리 |
GRAMINALES |
풀 |
잔디 |
JAPANESE_CEDAR |
일본 삼나무 |
트리 |
JAPANESE_CYPRESS |
일본 편백나무 |
트리 |
RAGWEED |
돼지풀 |
잡초 |
MUGWORT |
쑥 |
잡초 |
달리 명시되지 않는 한 이 페이지의 콘텐츠에는 Creative Commons Attribution 4.0 라이선스에 따라 라이선스가 부여되며, 코드 샘플에는 Apache 2.0 라이선스에 따라 라이선스가 부여됩니다. 자세한 내용은 Google Developers 사이트 정책을 참조하세요. 자바는 Oracle 및/또는 Oracle 계열사의 등록 상표입니다.
최종 업데이트: 2025-08-31(UTC)
[null,null,["최종 업데이트: 2025-08-31(UTC)"],[[["\u003cp\u003eThe Universal Pollen Index (UPI) provides a globally unified scale for comparing pollen levels, aiding in assessing pollen exposure risk.\u003c/p\u003e\n"],["\u003cp\u003eThe UPI utilizes a six-category system (None, Very Low, Low, Moderate, High, Very High) to represent pollen concentration and potential allergy symptom severity.\u003c/p\u003e\n"],["\u003cp\u003eHeatmap tiles visually display the UPI globally for three plant types: Tree, Grass, and Weed, allowing for easy comparison across locations.\u003c/p\u003e\n"],["\u003cp\u003eSupported plant types in the Pollen API include a variety of trees, grasses, and weeds, although availability may vary based on data source and location.\u003c/p\u003e\n"]]],["The Universal Pollen Index (UPI) is a global scale for comparing pollen levels, assessing pollen exposure risk. It utilizes a multilayer model, considering concentration per plant, local pollen indices, and allergenicity to predict pollen grains per cubic meter. The UPI ranges from 0 (None) to 5 (Very High), using heatmap tiles to visualize `TREE`, `GRASS`, or `WEED` pollen. The API supports various plant types, including `ALDER`, `OAK`, `GRAMINALES`, `RAGWEED`, and more.\n"],null,["# Pollen Index\n\nWhat is the Universal Pollen Index (UPI)?\n-----------------------------------------\n\nThe Universal Pollen Index (UPI) is designed to offer a globally unified scale\nfor comparing pollen levels across different areas. The index helps assess the\nrisk of pollen exposure based on various factors for people allergic or\nsensitive to pollen. Based on a multilayer model, it is a representation of\npollen level data that considers the concentration per plant model, many\ndifferent local pollen indices (LPI) used worldwide, and the allergenicity of\ndifferent plant pollen types to predict the number of pollen grains per cubic\nmeter (grains/m3) per day.\n\nThe heatmapTiles endpoint returns heatmap tiles that can be overlaid\non a basemap. Heatmap tiles display the UPI across the globe for a given plant\ntype (`TREE`, `GRASS`, or `WEED`).\n\nThe index consists of six categories:\n\n| Value | Color | Description |\n|-------|-------|-------------|\n| 0 | | None |\n| 1 | | Very Low |\n| 2 | | Low |\n| 3 | | Moderate |\n| 4 | | High |\n| 5 | | Very High |\n\nEach category is based on specific concentration levels of pollen in a\nparticular area and their effect on the severity of allergic symptoms that are\nusually experienced, providing a comprehensive representation of pollen levels.\nBy integrating the UPI, users can compare and assess pollen conditions in\nvarious locations.\n\nFor example, the following heatmap tile shows `TREE` pollen levels ranging from\n**Very Low** to **Very High**:\n\nSupported plants\n----------------\n\nThe Pollen API supports 3 different types of plants: **Grass** , **Weed** ,\nand **Tree**. Because a plant's availability is subject to actual data source\nmeasurements and reports, Pollen API plant data may vary across locations.\n\nThe following list shows supported plant codes and their metadata:\n\n| Plant Code | Display Name | Type |\n| `ALDER` | Alder | Tree |\n| `ASH` | Ash | Tree |\n| `BIRCH` | Birch | Tree |\n| `COTTONWOOD` | Cottonwood | Tree |\n| `ELM` | Elm | Tree |\n| `MAPLE` | Maple | Tree |\n| `OLIVE` | Olive | Tree |\n| `JUNIPER` | Juniper | Tree |\n| `OAK` | Oak | Tree |\n| `PINE` | Pine | Tree |\n| `CYPRESS_PINE` | Cypress pine | Tree |\n| `HAZEL` | Hazel | Tree |\n| `GRAMINALES` | Grasses | Grass |\n| `JAPANESE_CEDAR` | Japanese cedar | Tree |\n| `JAPANESE_CYPRESS` | Japanese cypress | Tree |\n| `RAGWEED` | Ragweed | Weed |\n| `MUGWORT` | Mugwort | Weed |\n|--------------------|------------------|-------|"]]