亮眼指數
透過集合功能整理內容
你可以依據偏好儲存及分類內容。
什麼是通用花粉指數 (UPI)?
通用花粉指數 (UPI) 採用全球統一的標準,方便比較不同地區的花粉濃度。花粉指數會根據多項因素,評估對花粉過敏或敏感者接觸花粉的風險。這項資料是以多層模型為基礎,考量每種植物模型的濃度、全球使用的許多不同當地花粉指數 (LPI),以及不同植物花粉類型的致敏性,預測每日每立方公尺的花粉粒數 (粒/公尺 3)。
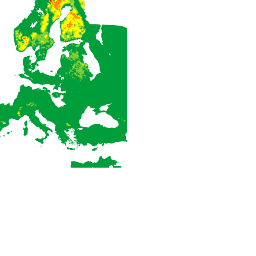
heatmapTiles 端點會傳回可疊加在基本地圖上的熱視圖圖塊。熱度圖圖塊會顯示特定植物類型 (TREE
、GRASS
或 WEED
) 的全球 UPI。
這項指數分為六個類別:
值 |
顏色 |
說明 |
0 |
 |
無 |
1 |
 |
極低 |
2 |
 |
低 |
3 |
 |
中 |
4 |
 |
高 |
5 |
 |
非常高 |
每個類別都以特定區域的花粉濃度為依據,以及花粉對一般過敏症狀嚴重程度的影響,全面呈現花粉濃度。整合 UPI 後,使用者就能比較及評估不同地點的花粉狀況。
舉例來說,以下熱視圖方塊顯示的花粉濃度範圍從「非常低」到「非常高」:TREE

支援的植物
花粉 API 支援 3 種不同類型的植物:草、雜草和樹木。由於植物的供應情形取決於實際資料來源的測量結果和報告,花粉 API 的植物資料可能會因地點而異。
以下列出支援的植物代碼及其相關中繼資料:
工廠代碼 |
顯示名稱 |
類型 |
ALDER |
Alder |
樹 |
ASH |
清水模灰 |
樹 |
BIRCH |
樺木灰 |
樹 |
COTTONWOOD |
Cottonwood |
樹 |
ELM |
Elm |
樹 |
MAPLE |
Maple |
樹 |
OLIVE |
Olive |
樹 |
JUNIPER |
Juniper |
樹 |
OAK |
橡木 |
樹 |
PINE |
Pine |
樹 |
CYPRESS_PINE |
柏松 |
樹 |
HAZEL |
霧灰色 |
樹 |
GRAMINALES |
禾草 |
草 |
JAPANESE_CEDAR |
日本柳杉 |
樹 |
JAPANESE_CYPRESS |
日本扁柏 |
樹 |
RAGWEED |
豚草 |
雜草 |
MUGWORT |
艾草 |
雜草 |
除非另有註明,否則本頁面中的內容是採用創用 CC 姓名標示 4.0 授權,程式碼範例則為阿帕契 2.0 授權。詳情請參閱《Google Developers 網站政策》。Java 是 Oracle 和/或其關聯企業的註冊商標。
上次更新時間:2025-08-31 (世界標準時間)。
[null,null,["上次更新時間:2025-08-31 (世界標準時間)。"],[[["\u003cp\u003eThe Universal Pollen Index (UPI) provides a globally unified scale for comparing pollen levels, aiding in assessing pollen exposure risk.\u003c/p\u003e\n"],["\u003cp\u003eThe UPI utilizes a six-category system (None, Very Low, Low, Moderate, High, Very High) to represent pollen concentration and potential allergy symptom severity.\u003c/p\u003e\n"],["\u003cp\u003eHeatmap tiles visually display the UPI globally for three plant types: Tree, Grass, and Weed, allowing for easy comparison across locations.\u003c/p\u003e\n"],["\u003cp\u003eSupported plant types in the Pollen API include a variety of trees, grasses, and weeds, although availability may vary based on data source and location.\u003c/p\u003e\n"]]],["The Universal Pollen Index (UPI) is a global scale for comparing pollen levels, assessing pollen exposure risk. It utilizes a multilayer model, considering concentration per plant, local pollen indices, and allergenicity to predict pollen grains per cubic meter. The UPI ranges from 0 (None) to 5 (Very High), using heatmap tiles to visualize `TREE`, `GRASS`, or `WEED` pollen. The API supports various plant types, including `ALDER`, `OAK`, `GRAMINALES`, `RAGWEED`, and more.\n"],null,["# Pollen Index\n\nWhat is the Universal Pollen Index (UPI)?\n-----------------------------------------\n\nThe Universal Pollen Index (UPI) is designed to offer a globally unified scale\nfor comparing pollen levels across different areas. The index helps assess the\nrisk of pollen exposure based on various factors for people allergic or\nsensitive to pollen. Based on a multilayer model, it is a representation of\npollen level data that considers the concentration per plant model, many\ndifferent local pollen indices (LPI) used worldwide, and the allergenicity of\ndifferent plant pollen types to predict the number of pollen grains per cubic\nmeter (grains/m3) per day.\n\nThe heatmapTiles endpoint returns heatmap tiles that can be overlaid\non a basemap. Heatmap tiles display the UPI across the globe for a given plant\ntype (`TREE`, `GRASS`, or `WEED`).\n\nThe index consists of six categories:\n\n| Value | Color | Description |\n|-------|-------|-------------|\n| 0 | | None |\n| 1 | | Very Low |\n| 2 | | Low |\n| 3 | | Moderate |\n| 4 | | High |\n| 5 | | Very High |\n\nEach category is based on specific concentration levels of pollen in a\nparticular area and their effect on the severity of allergic symptoms that are\nusually experienced, providing a comprehensive representation of pollen levels.\nBy integrating the UPI, users can compare and assess pollen conditions in\nvarious locations.\n\nFor example, the following heatmap tile shows `TREE` pollen levels ranging from\n**Very Low** to **Very High**:\n\nSupported plants\n----------------\n\nThe Pollen API supports 3 different types of plants: **Grass** , **Weed** ,\nand **Tree**. Because a plant's availability is subject to actual data source\nmeasurements and reports, Pollen API plant data may vary across locations.\n\nThe following list shows supported plant codes and their metadata:\n\n| Plant Code | Display Name | Type |\n| `ALDER` | Alder | Tree |\n| `ASH` | Ash | Tree |\n| `BIRCH` | Birch | Tree |\n| `COTTONWOOD` | Cottonwood | Tree |\n| `ELM` | Elm | Tree |\n| `MAPLE` | Maple | Tree |\n| `OLIVE` | Olive | Tree |\n| `JUNIPER` | Juniper | Tree |\n| `OAK` | Oak | Tree |\n| `PINE` | Pine | Tree |\n| `CYPRESS_PINE` | Cypress pine | Tree |\n| `HAZEL` | Hazel | Tree |\n| `GRAMINALES` | Grasses | Grass |\n| `JAPANESE_CEDAR` | Japanese cedar | Tree |\n| `JAPANESE_CYPRESS` | Japanese cypress | Tree |\n| `RAGWEED` | Ragweed | Weed |\n| `MUGWORT` | Mugwort | Weed |\n|--------------------|------------------|-------|"]]