系统未显示我的可视化图表,并提示“社区可视化图表已停用”
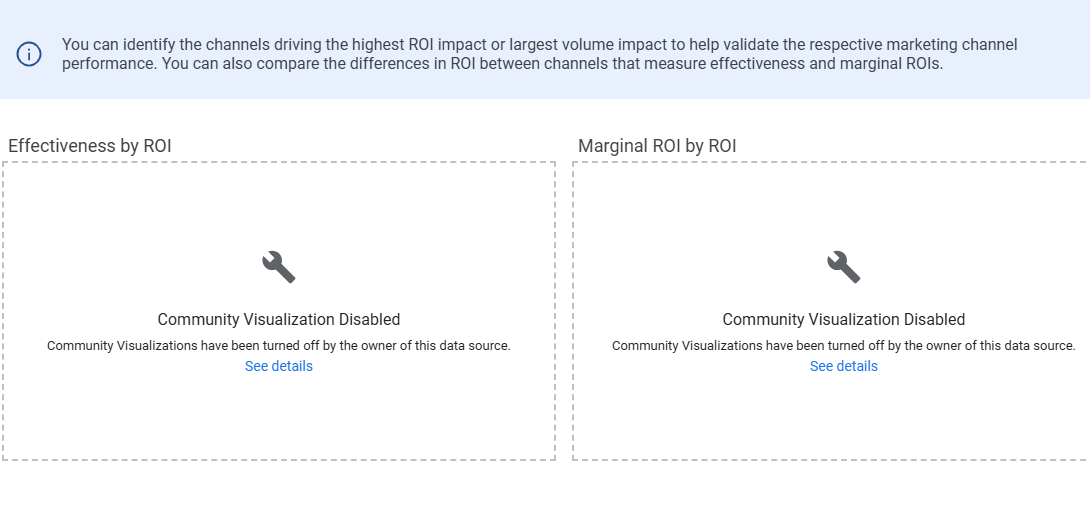
出现此问题是因为相关报告尚未保存。请按照以下说明操作:
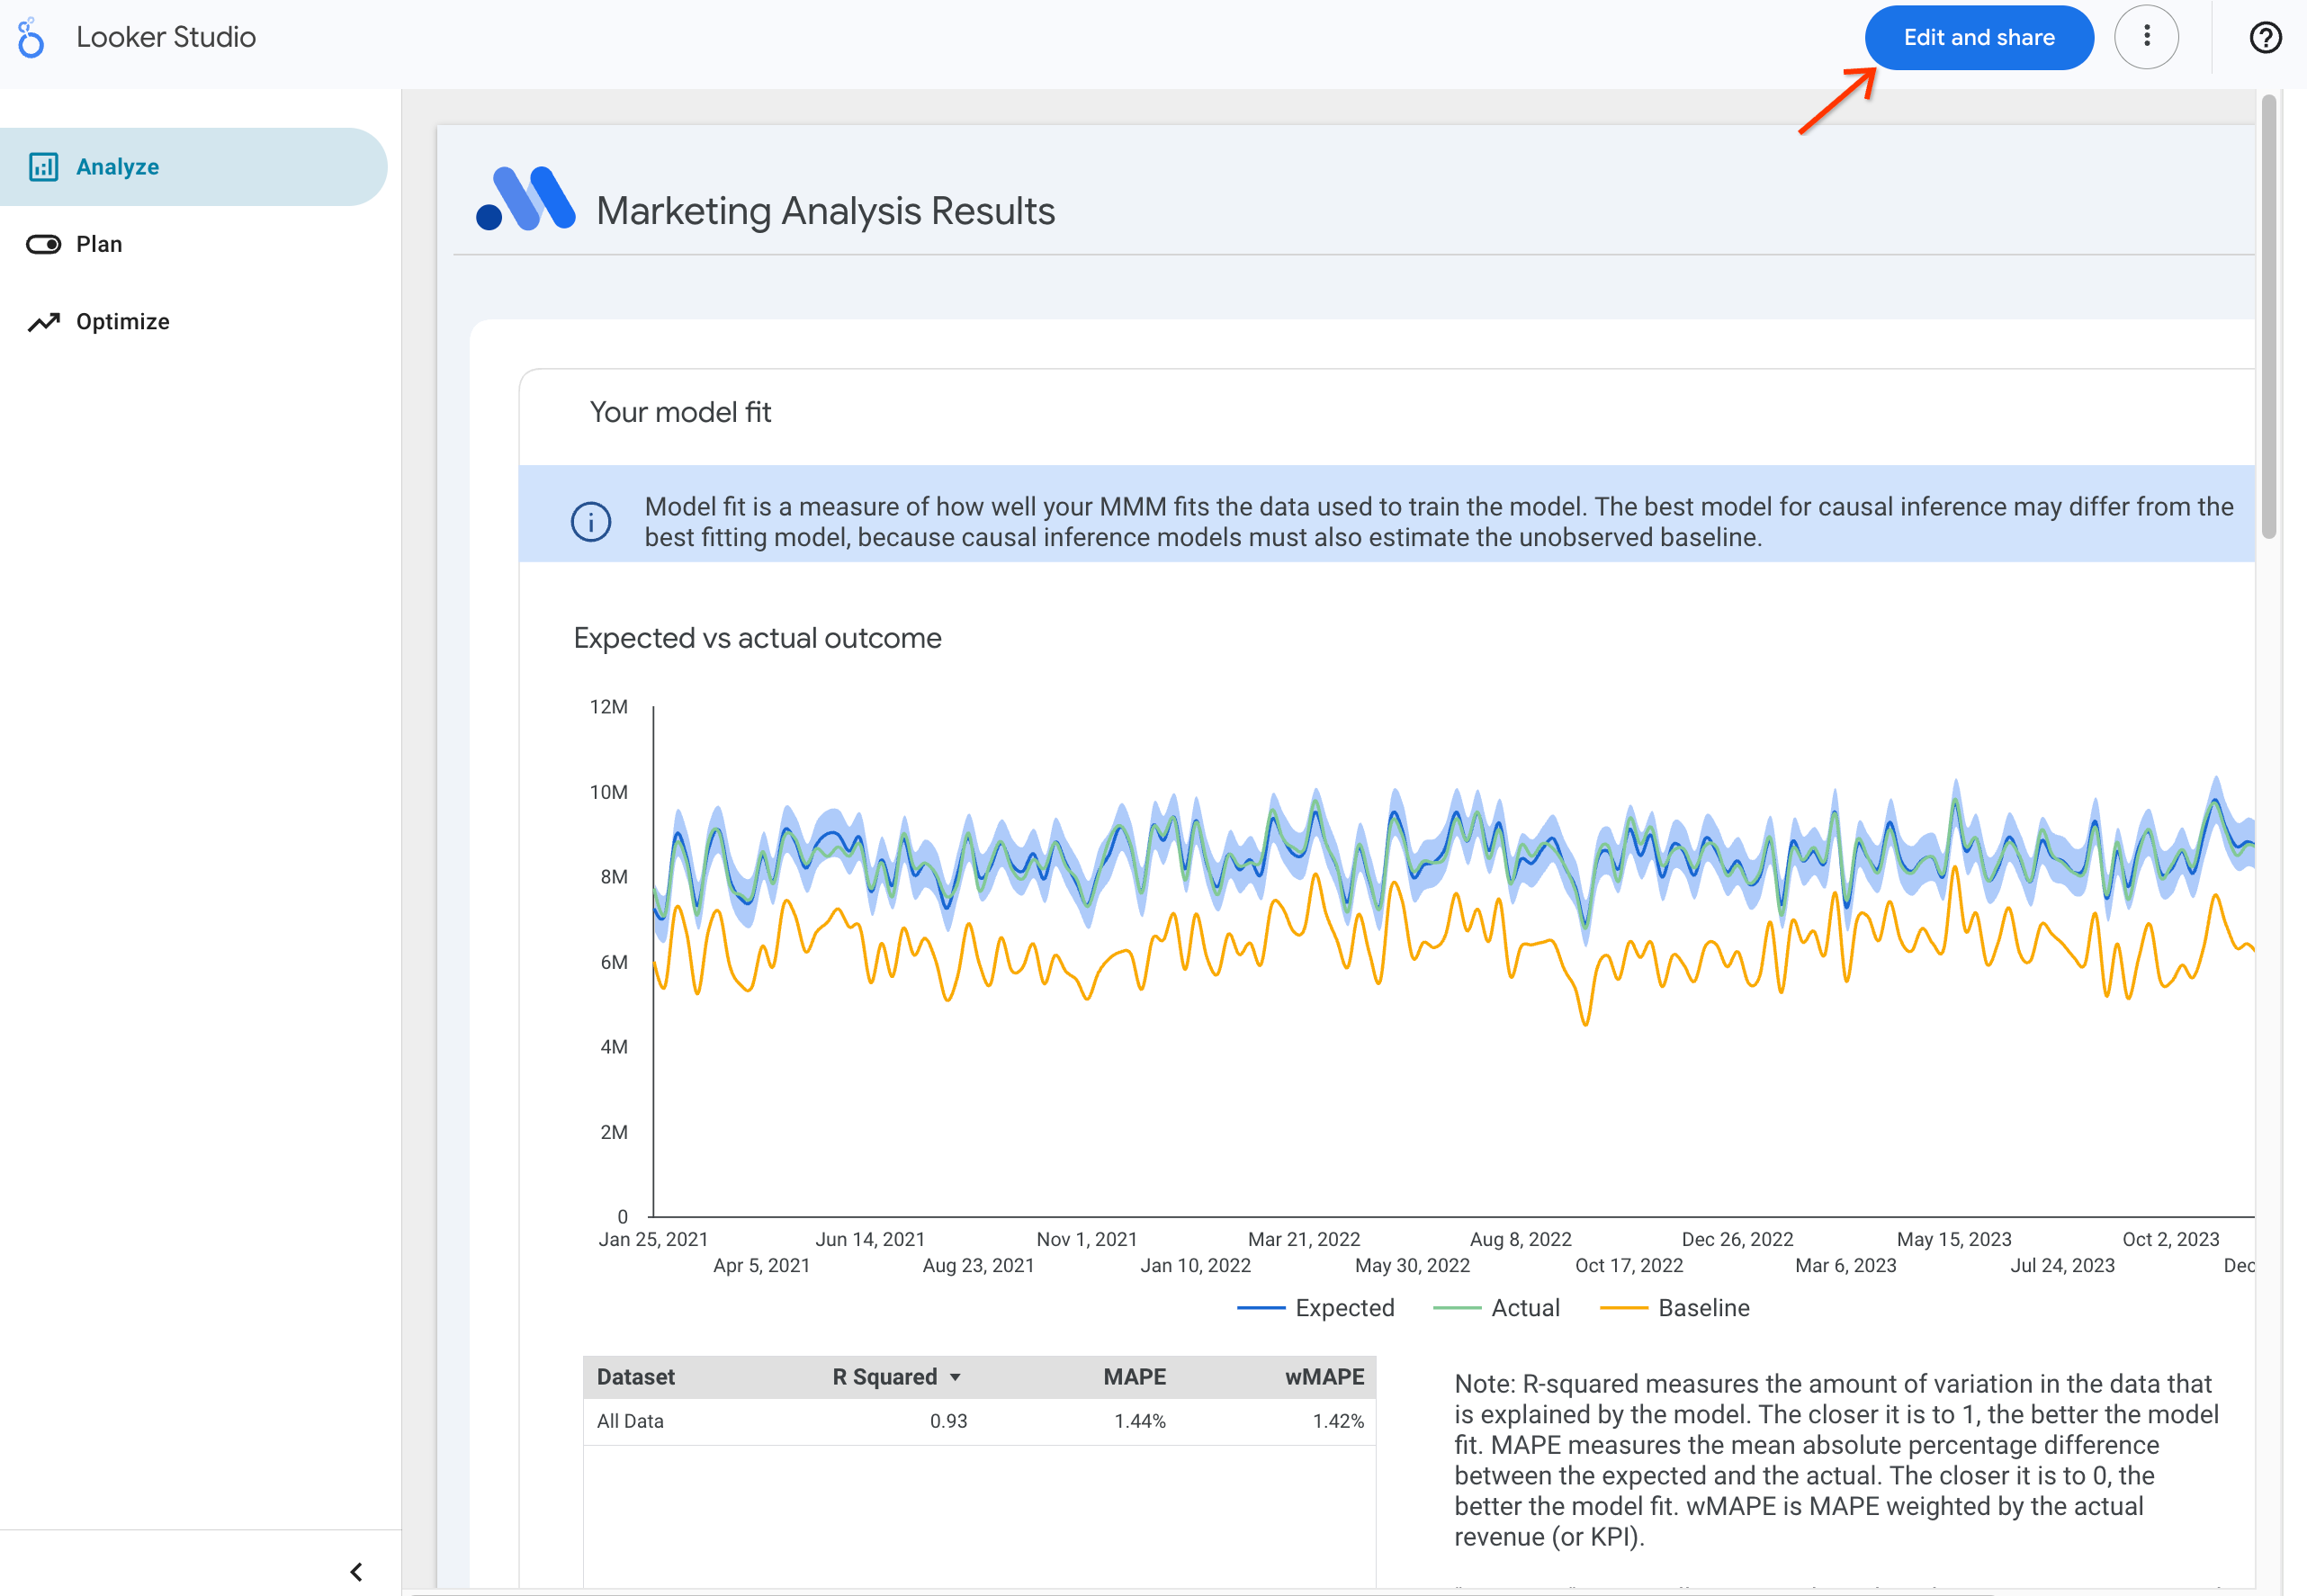
- 点击页面顶部的“修改并分享”按钮
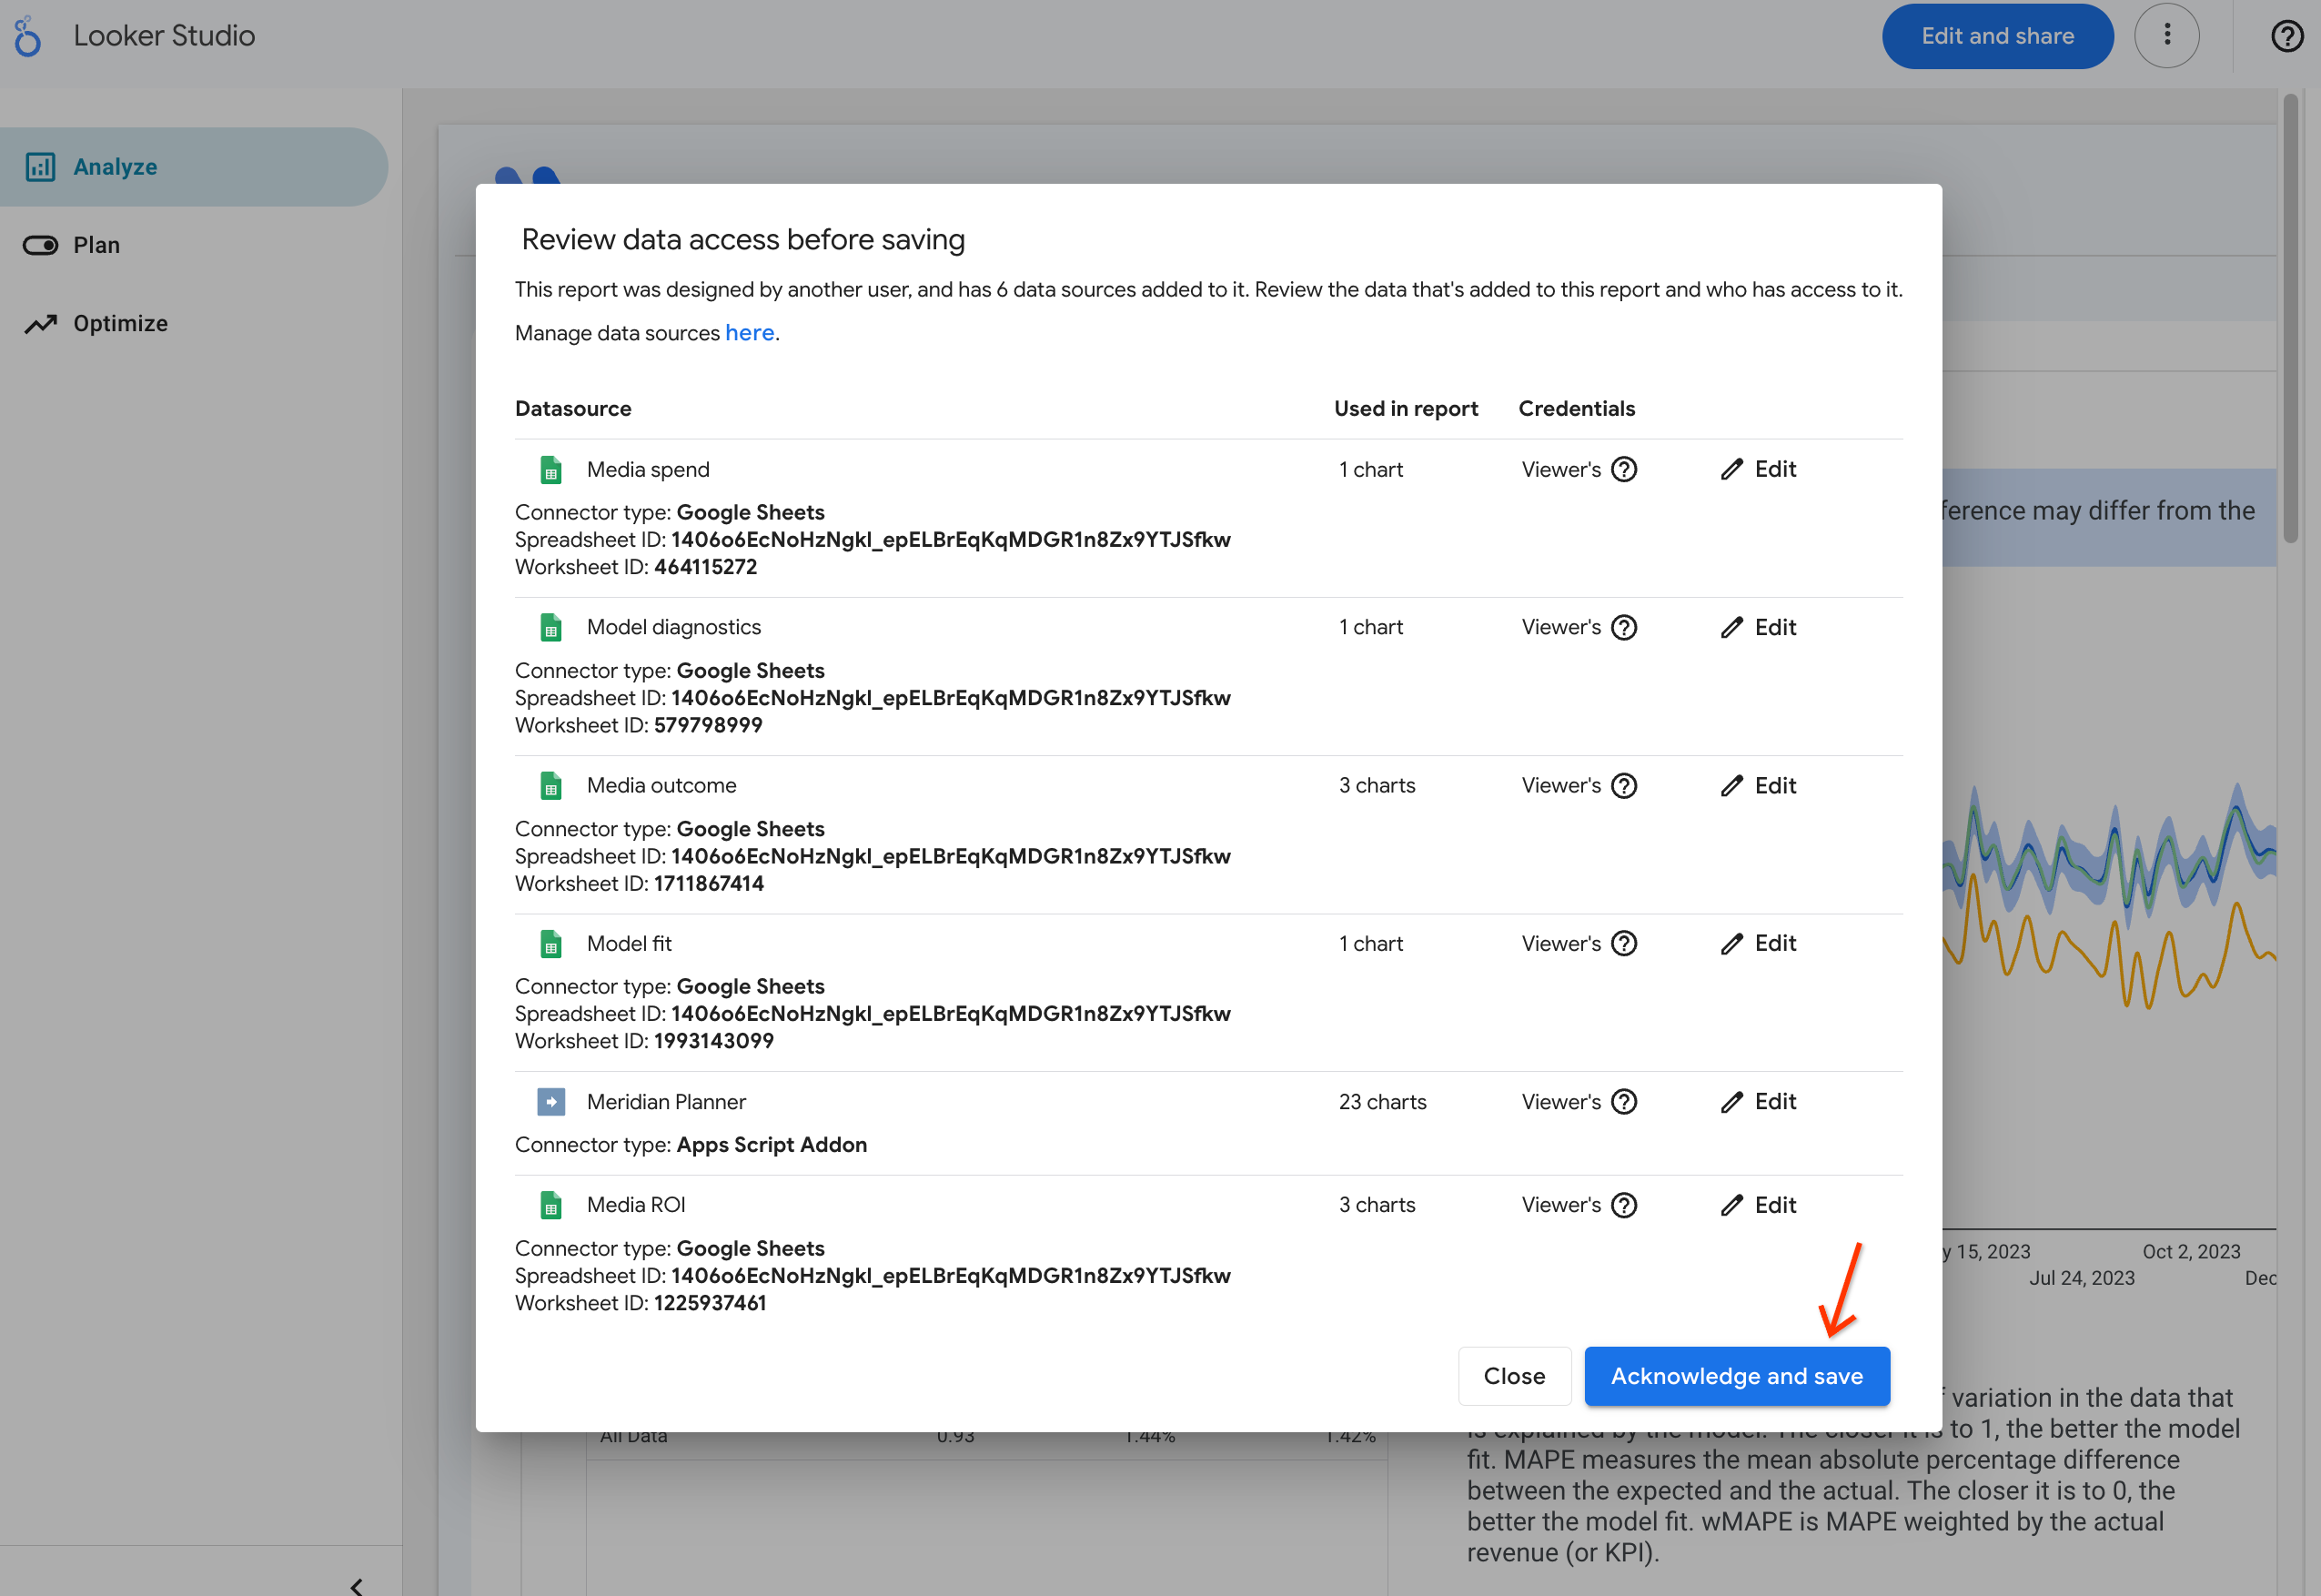
- 点击弹出式窗口中的“确认并保存”按钮
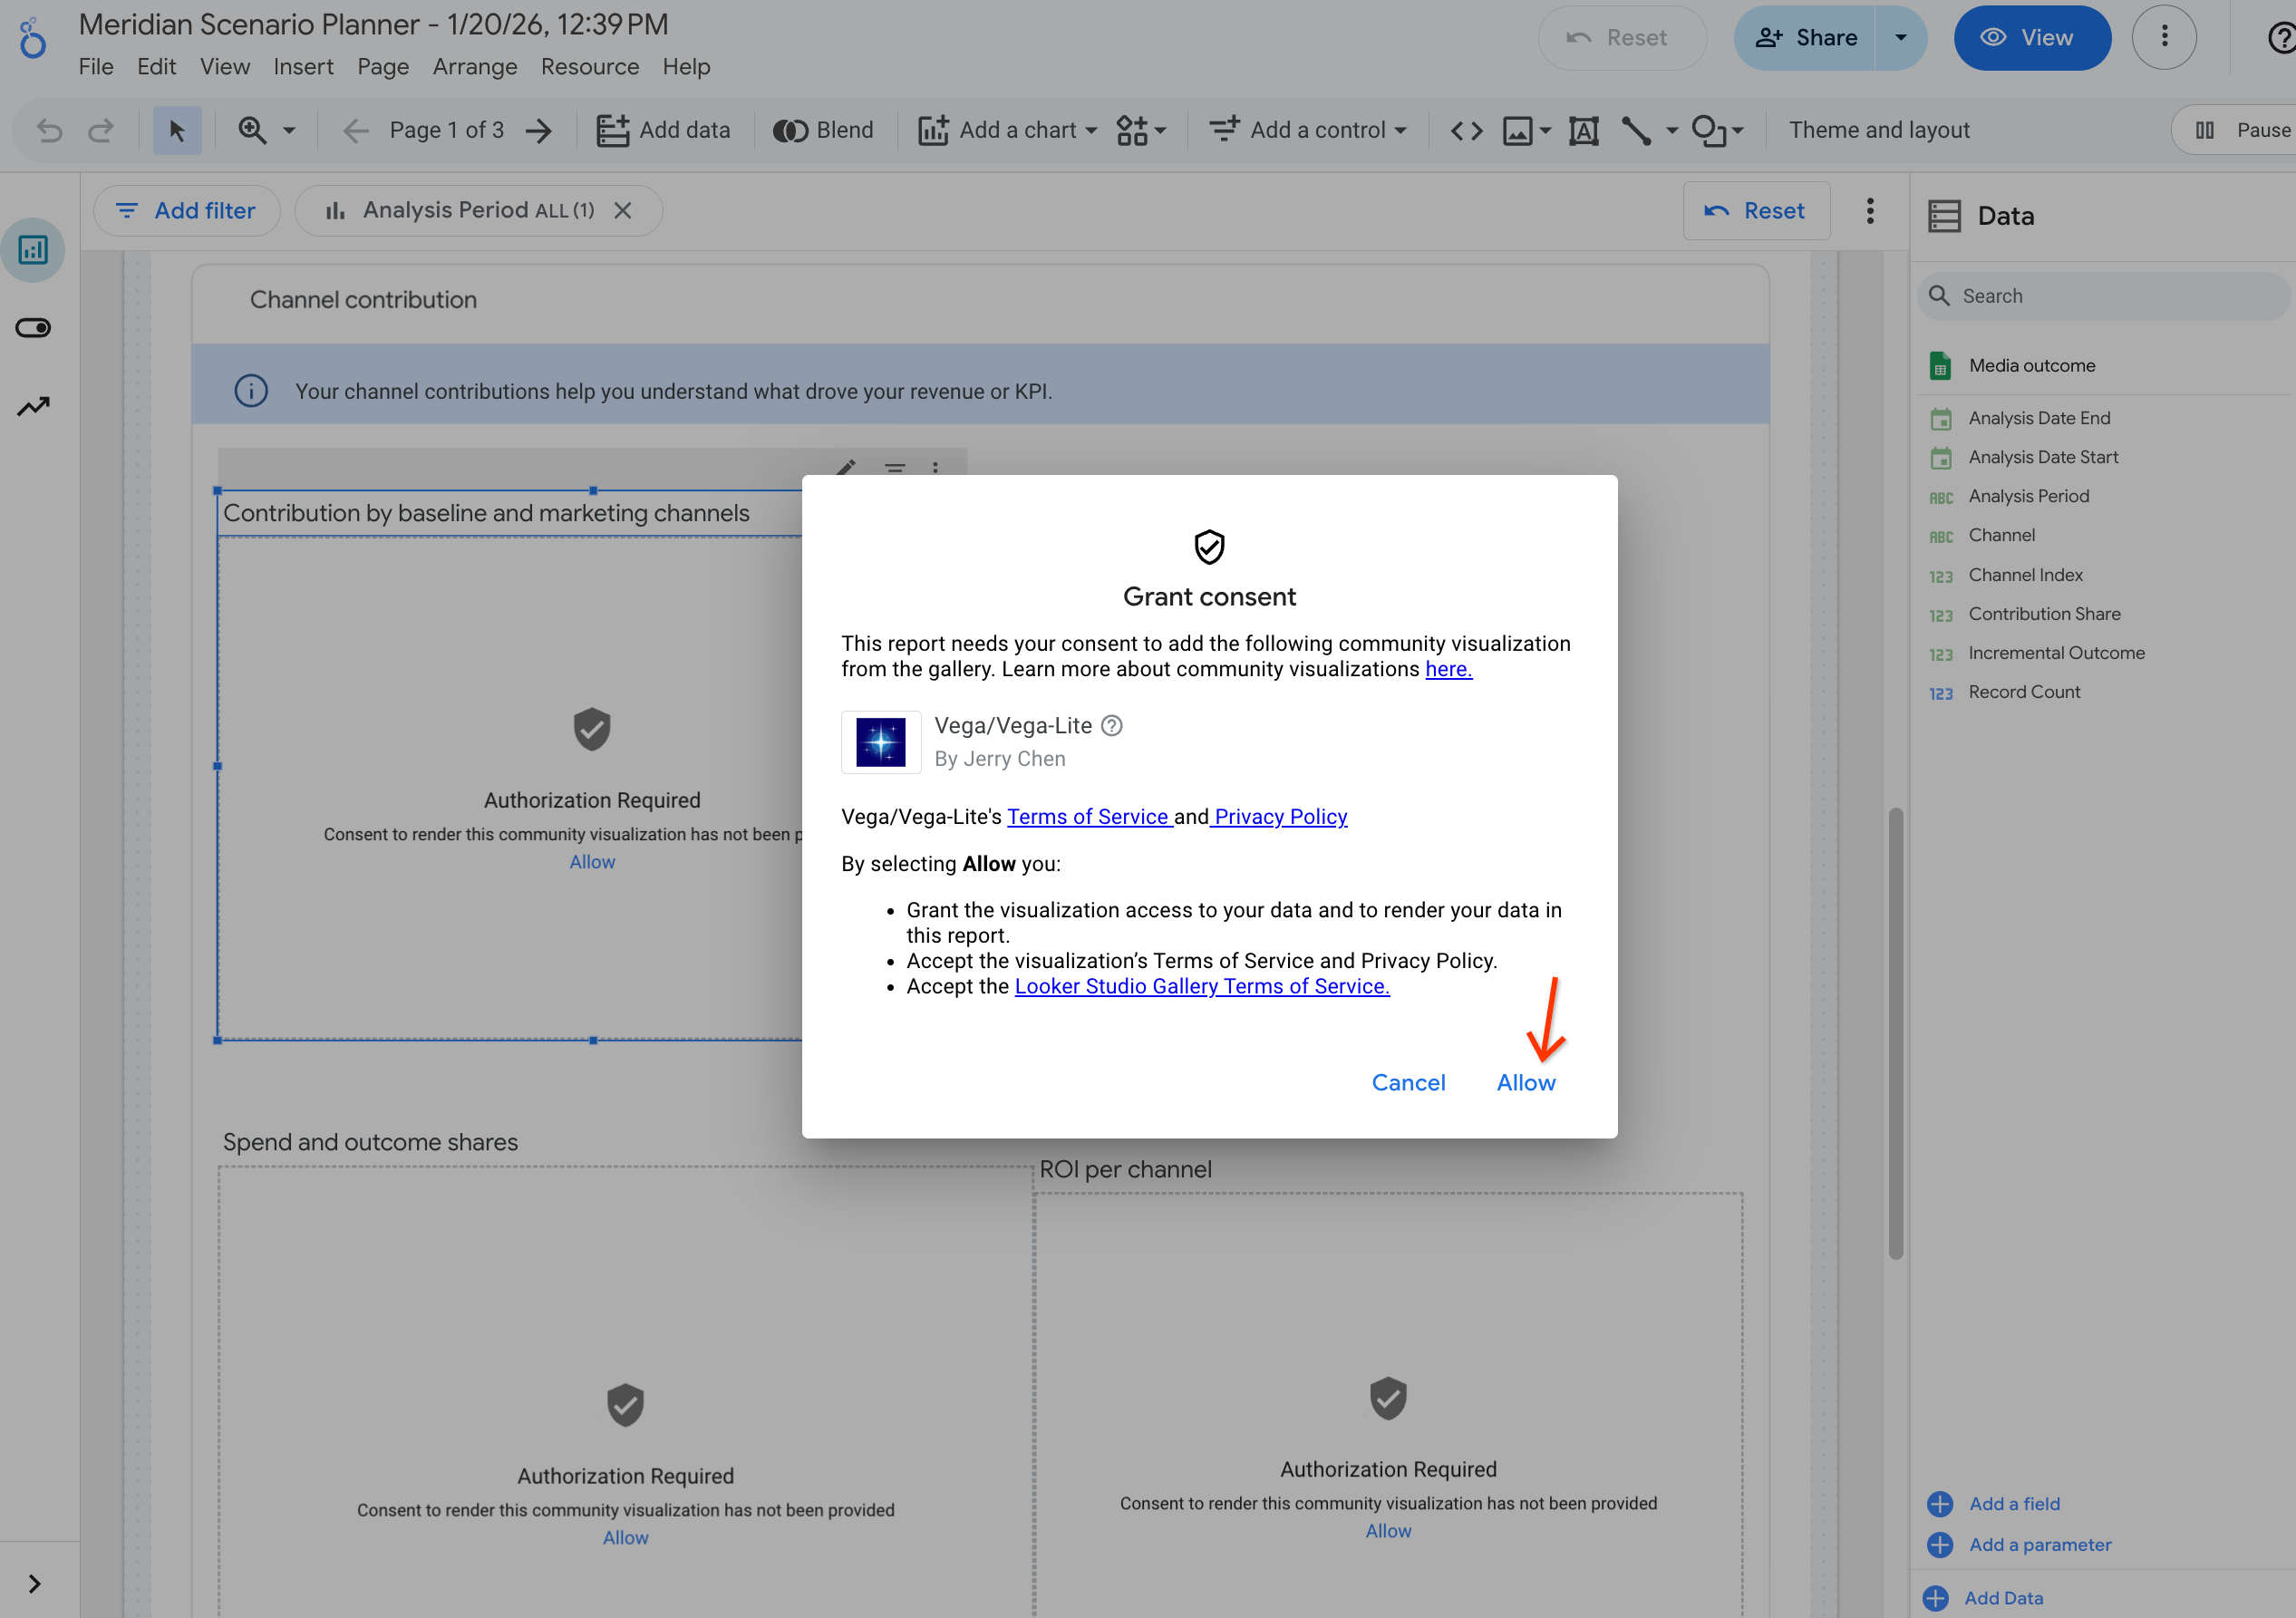
- 滚动屏幕,找到需要授权的图表,然后点击“允许”字样
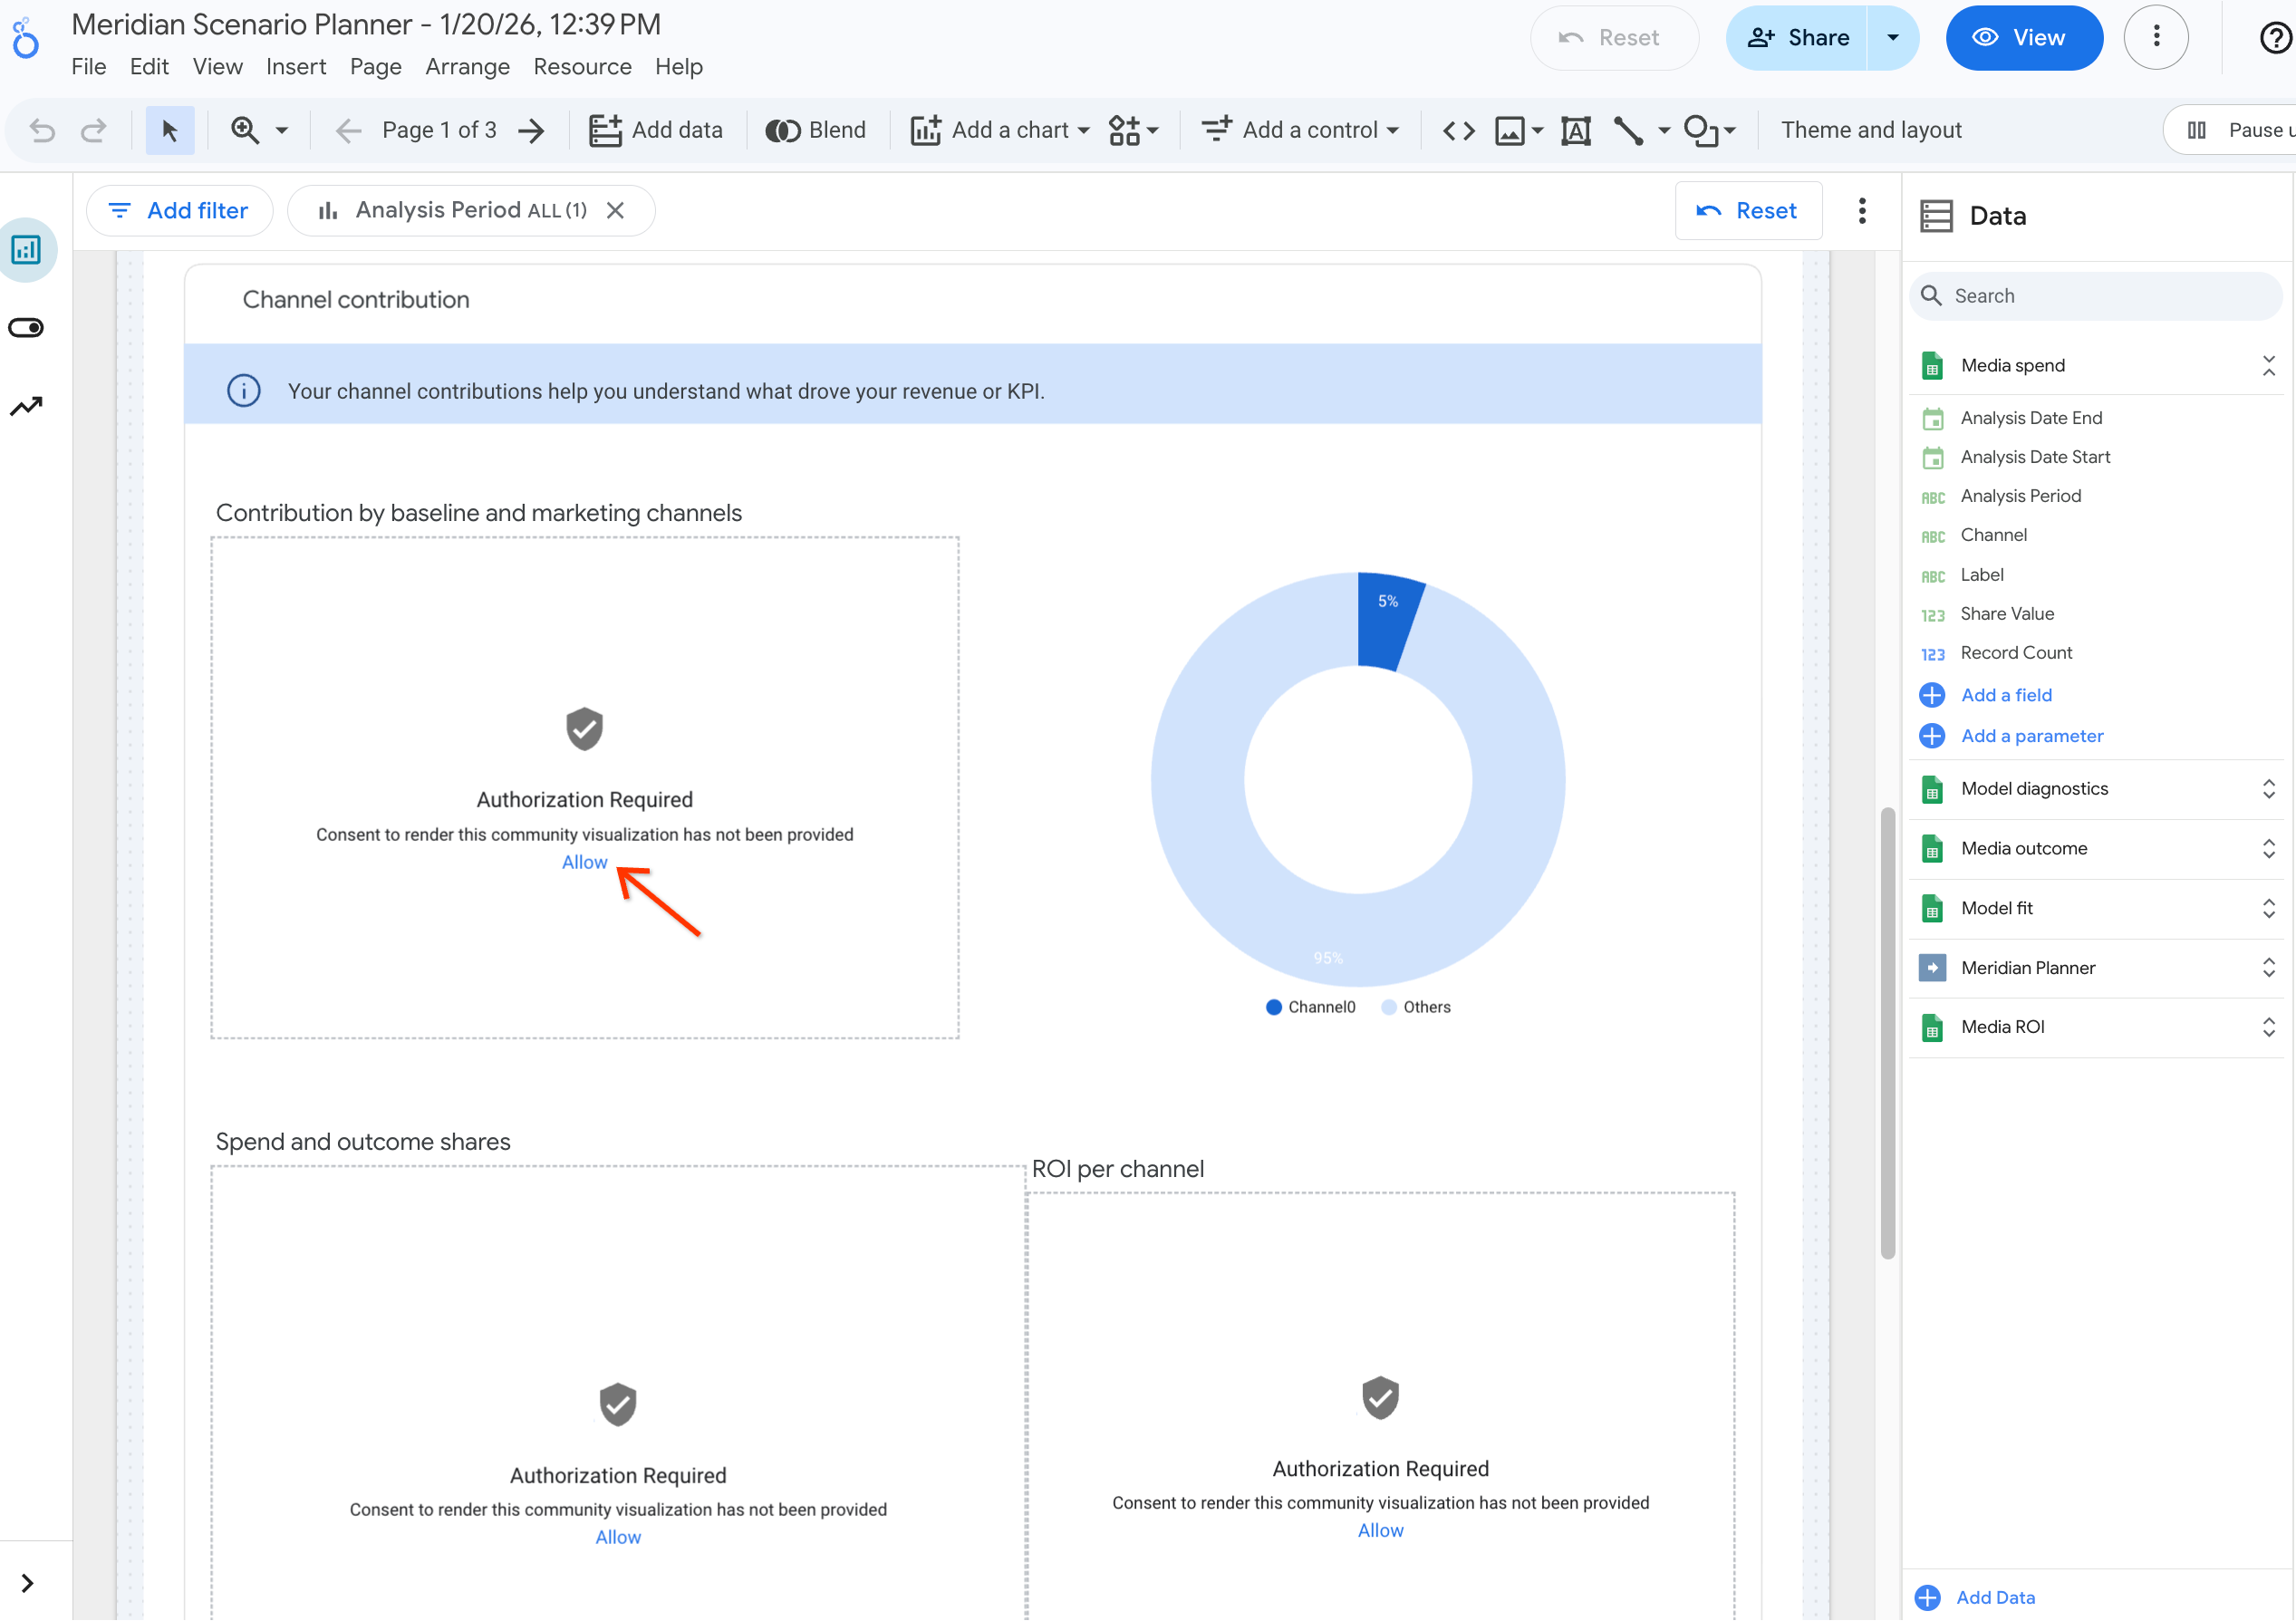
- 在弹出式窗口中,点击“允许”按钮以同意使用社区可视化图表
- 刷新页面,图表应会正常显示
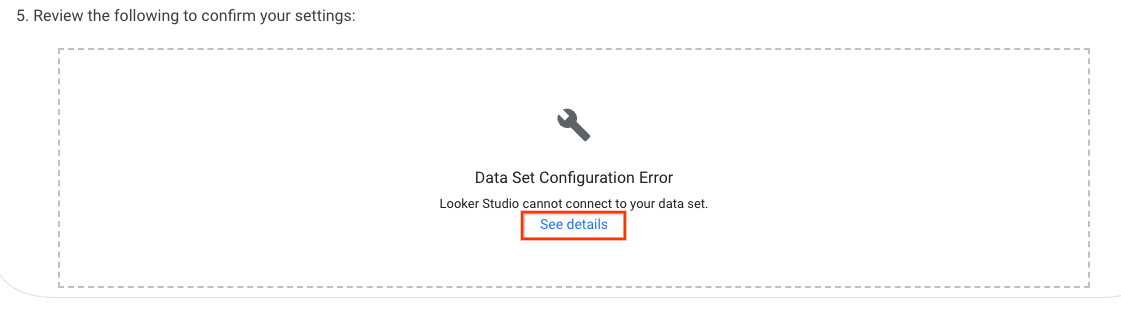
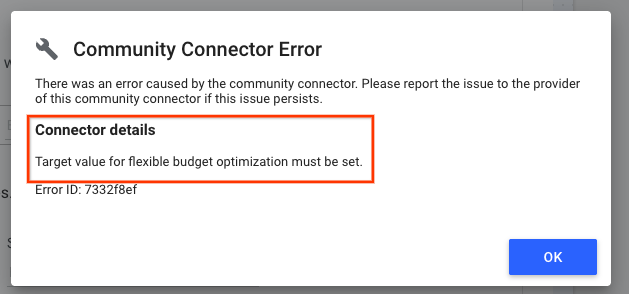
我在“规划”页面上遇到了“数据集配置错误”。
这种情况通常是由不可行的方案设置导致的。点击“查看详情”可深入了解此错误。如果您在使用此工具时遇到任何无法解决的问题,请通过 Meridian GitHub 的“Issues”页面报告问题。
Colab 卡在“生成信息中心”环节,或者生成时间过长。
方案生成功能的性能取决于模型大小、时间粒度和硬件选择。如果您遇到处理时间过长的问题,请尝试降低粒度,或限制覆盖面和频次范围(如果已启用)。如果情况仍未改善,或者运行的单元持续崩溃,请通过 Meridian GitHub 的“Issues”页面报告问题。为便于我们深入解决您的问题,请务必提供可重现此错误的详细信息。