Part 2 of 3 on debugging Attribution Reporting. Set up your debug reports.
Glossary
- 报告来源是用于设置归因报告来源和触发器标头的来源。浏览器生成的所有报告都会发送到此源。在本指南中,我们使用
https://adtech.example作为示例报告来源。 - 归因报告(简称“报告”)是包含您请求的衡量数据的最终报告(事件级报告或可汇总报告)。
- 调试报告包含有关归因报告或者来源或触发器事件的其他数据。收到调试报告并不一定表示存在问题!调试报告有两种
- 过渡调试报告是一种调试报告,需要设置 Cookie 才能生成和发送。如果 Cookie 未设置且第三方 Cookie 被弃用,过渡调试报告将不可用。本指南中描述的所有调试报告都是过渡性调试报告。
- 成功调试报告用于跟踪成功生成归因报告。它们与归因报告直接相关。从 Chrome 101(2022 年 4 月)开始,已提供成功调试报告。
- 详细调试报告可以跟踪缺失的报告,并帮助您确定缺失报告的原因。它们分别用于表明浏览器未记录来源或触发器事件(这意味着浏览器不会生成归因报告)以及由于某种原因无法生成或发送归因报告的情况。详细调试报告包含一个
type字段,用于说明未生成来源事件、触发器事件或归因报告的原因。从 Chrome 109(2023 年 1 月稳定版)开始提供详细调试报告。 - 调试键是您可以在来源端和触发器端设置的唯一标识符。通过调试键,您可以映射基于 Cookie 的转化和基于归因的转化。将系统设置为生成调试报告并设置调试密钥后,浏览器会将这些调试密钥添加到所有归因报告和调试报告中。
如需了解我们的文档中使用的更多概念和关键术语,请参阅 Privacy Sandbox 术语表。
Implementation questions?
If you encounter any issue while setting up debug reports, create an issue on our developer support repository and we'll help you troubleshoot.
Prepare to set up debug reports
Before you set up debug reports, follow these steps:
Check that you've applied best practices for API integration
Check that your code is gated behind feature detection. To be sure the API is not blocked by Permissions-Policy, run the following code:
if (document.featurePolicy.allowsFeature('attribution-reporting')) {
// the Attribution Reporting API is enabled
}
If this feature detection check returns true, the API is allowed in the context (page) where the check is run.
(Not required during the testing phase: Check that you've set a Permissions-Policy)
Fix fundamental integration issues
While debug reports are useful to help you detect and analyze loss at scale, some integration issues can be detected locally. Source and trigger header misconfiguration issues, JSON parsing issues, insecure context (non-HTTPS), and other issues that prevent the API from functioning will be surfaced in the DevTools Issues tab.
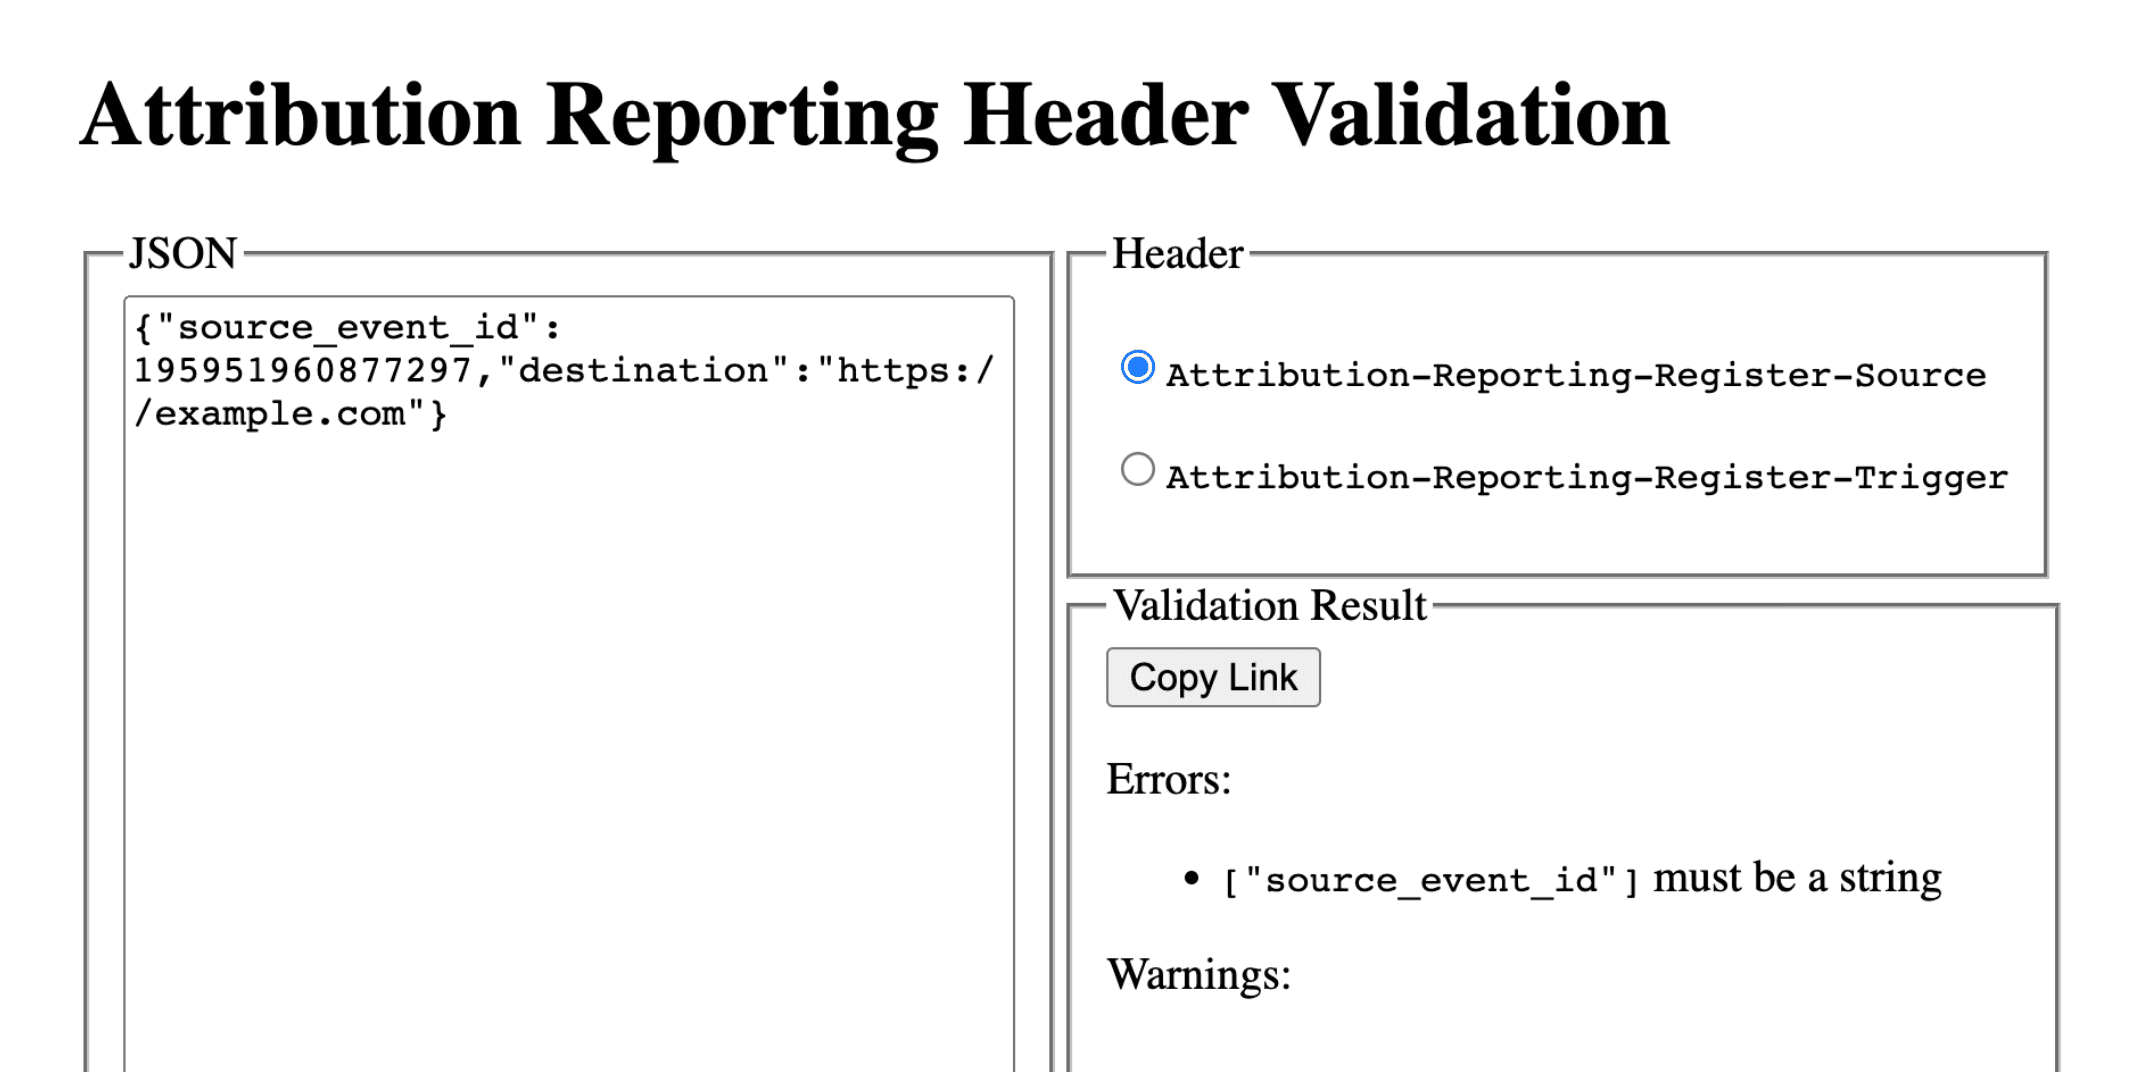
DevTools issues can be of different types. If you encounter an invalid header
issue, copy the header into the header validator
tool. This
will help you identify and fix the field that's causing an issue.
Set up debug reports: steps common to success reports and verbose reports
Set the following cookie on the reporting origin:
Set-Cookie: ar_debug=1; SameSite=None; Secure; Path=/; HttpOnly
The browser will check for the presence of this cookie on both source and trigger registration. The success debug report will only be generated if the cookie is present at both times.
Note that debug reports can be enabled for browsers in Mode B, where third-party cookies are disabled to facilitate testing and preparation for third-party cookie deprecation. For browsers in Mode B, you don't need to set the debug cookie to enable debug reports. Skip to step 2 to set up debug keys for success debug reports.
Step 2: Set debug keys
Each debug key must be a 64-bit unsigned integer formatted as a base-10 string. Make each debug key a unique ID. The success debug report will only be generated if the debug keys are set.
- Map the source-side debug key to additional source-time information you think is relevant for you to debug.
- Map the trigger-side debug key to additional trigger-time information you think is relevant for you to debug.
You could for example set the following debug keys:
- Cookie ID + Source timestamp as a source debug key (and capture that same timestamp in your cookie-based system)
- Cookie ID + Trigger timestamp as a trigger debug key (and capture that same timestamp in your cookie-based system)
With this, you can use cookie-based conversion information to look up the corresponding debug reports or attribution reports. Learn more in Part 3: Cookbook.
Make the source-side debug key different from source_event_id, so that you can
differentiate individual reports that have the same source event ID.
Attribution-Reporting-Register-Source:
{
// … Usual fields for Attribution-Reporting-Register-Source
"debug_key":"647775351539539"
}
Attribution-Reporting-Register-Trigger:
{
// … Usual fields for Attribution-Reporting-Register-Trigger
"debug_key":"938321351539743"
}
Demo code: source debug key Demo code: trigger debug key
Set up success debug reports
The example code in this section generates success debug reports for both event-level and aggregatable reports. Event-level and aggregatable reports use the same debug keys.
Step 3: Set up an endpoint to collect success debug reports
Set up an endpoint to collect the debug reports. This endpoint should be similar
to the main attribution endpoint, with an additional debug string in the path:
- Endpoint for event-level success debug reports:
https://adtech.example/.well-known/attribution-reporting/debug/report-event-attribution- Endpoint for aggregatable success debug reports:
https://adtech.example/.well-known/attribution-reporting/debug/report-aggregate-attribution
- Endpoint for aggregatable success debug reports:
When an attribution is triggered, the browser will immediately send a debug
report via a POST request to this endpoint. Your server code to handle
incoming success debug reports may look as follows (here on a node endpoint):
// Handle incoming event-Level Success Debug reports
adtech.post(
  '/.well-known/attribution-reporting/debug/report-event-attribution',
  async (req, res) => {
    // Debug report is in req.body
    res.sendStatus(200);
  }
);

// Handle incoming aggregatable Success Debug reports
adtech.post(
  '/.well-known/attribution-reporting/debug/report-aggregate-attribution',
  async (req, res) => {
    // Debug report is in req.body
    res.sendStatus(200);
  }
);
Demo code: event-level debug reports endpoint
Demo code: aggregatable debug reports endpoint
Step 4: Confirm your setup will generate success debug reports
- Open
chrome://attribution-internalsin your browser. - Make sure that the Show Debug Reports checkbox is checked, in both the Event-Level Reports and the Aggregatable Reports tabs.
- Open the sites on which you've implemented Attribution Reporting. Complete the steps you use to generate attribution reports; these same steps will generate success debug reports.
- In
chrome://attribution-internals:- Check that attribution reports are correctly generated.
- In the Event-Level Reports tab and the Aggregatable Reports tab,
check that the success debug reports are generated too. Recognize them
in the list with their blue
debugpath.
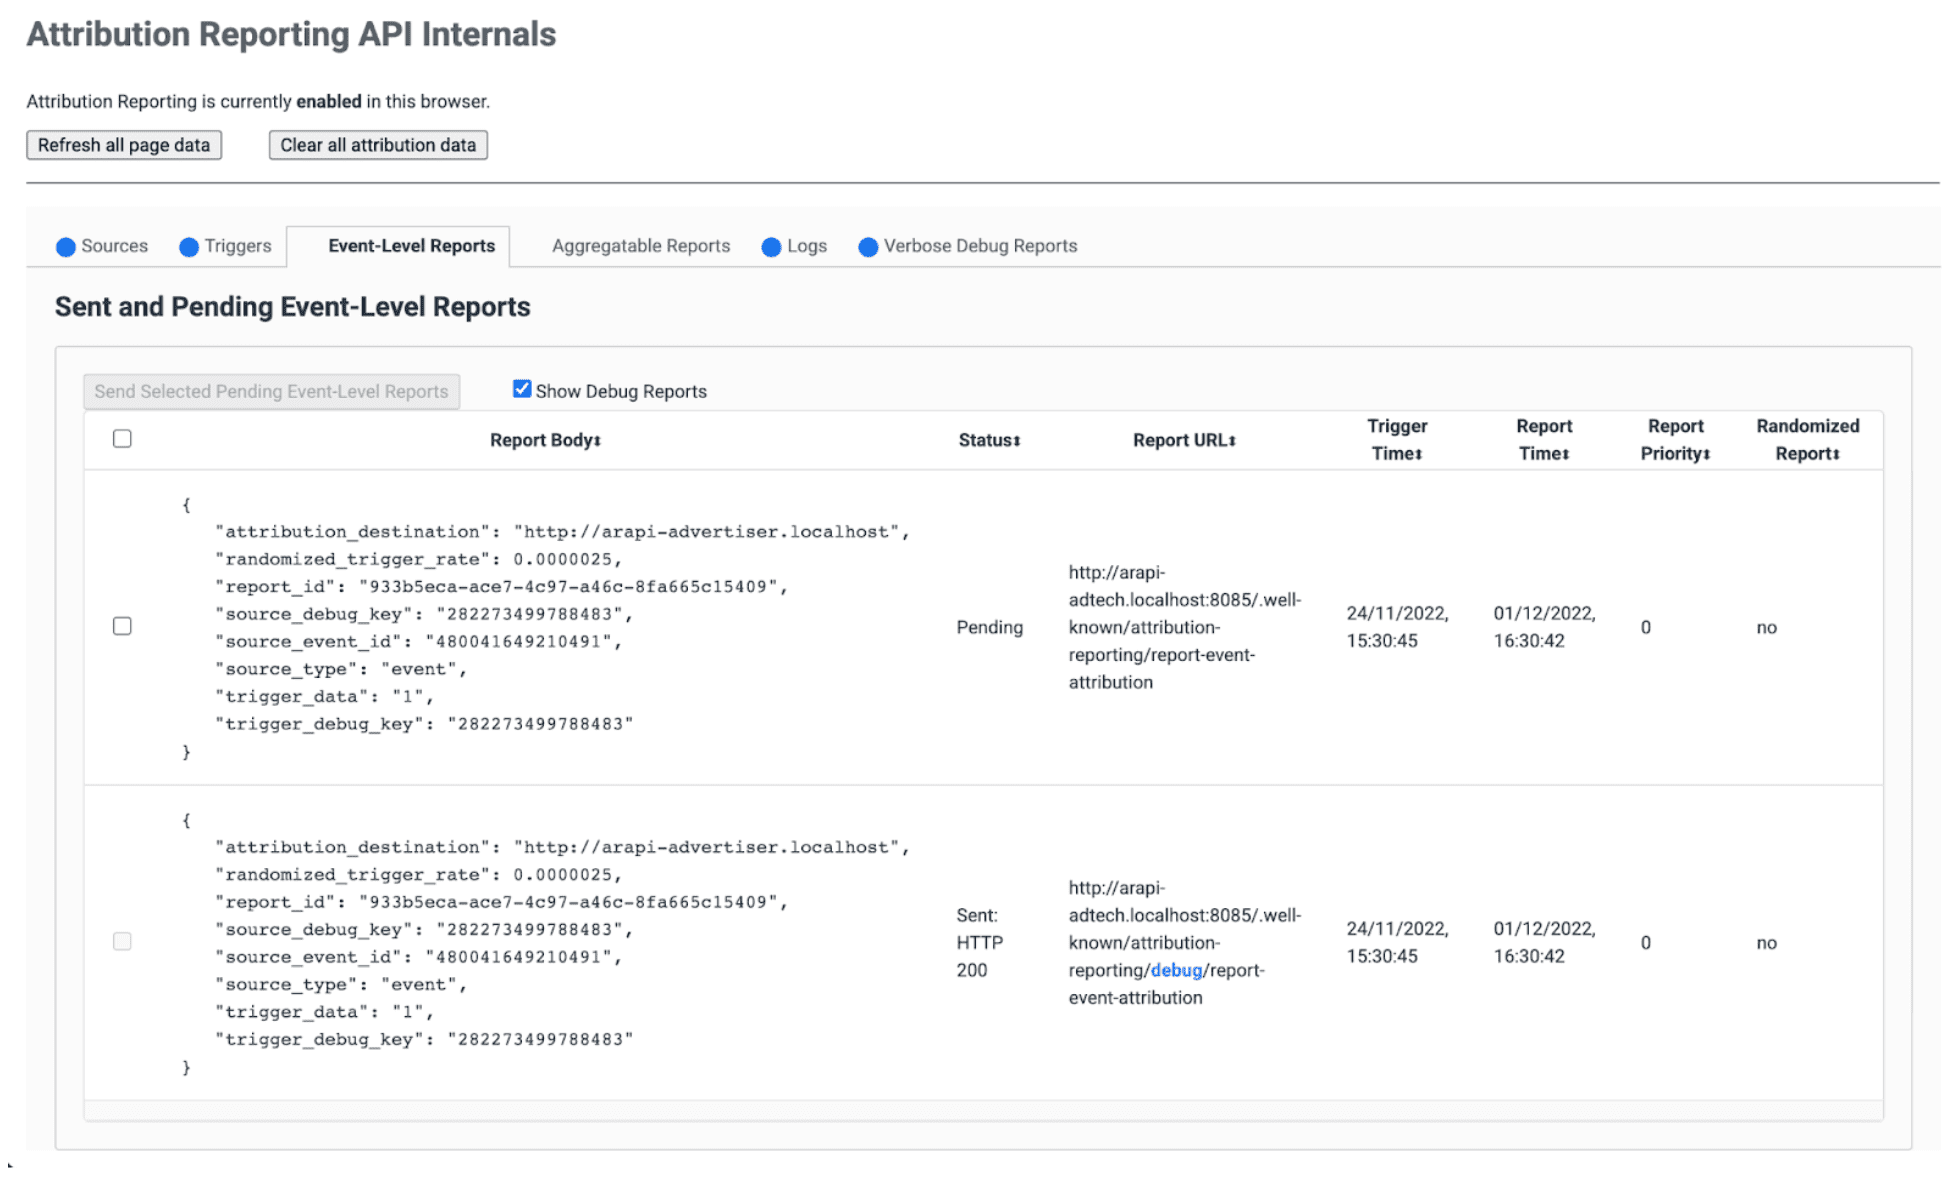
- On your server, verify that your endpoint immediately receives these success debug reports. Make sure to check for both event-level and aggregatable success debug reports.
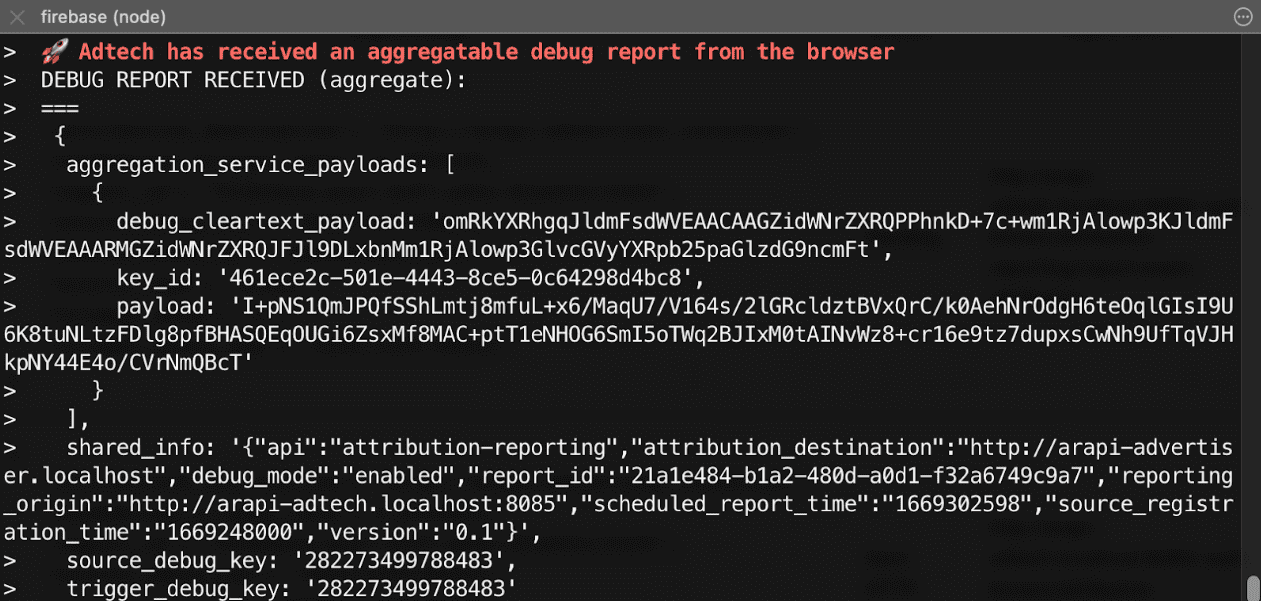
Step 5: Observe success debug reports
A success debug report is identical to an attribution report, and contains both the source-side and the trigger-side debug keys.
{
  "attribution_destination": "https://advertiser.example",
  "randomized_trigger_rate": 0.0000025,
  "report_id": "7d76ef29-d59e-4954-9fff-d97a743b4715",
  "source_debug_key": "647775351539539",
  "source_event_id": "760938763735530",
  "source_type": "event",
  "trigger_data": "0",
  "trigger_debug_key": "156477391437535"
}
{
  "aggregation_service_payloads": [
    {
      "debug_cleartext_payload": "omRkYXRhgqJldmFsdWVEAACAAGZidWNrZXRQPPhnkD+7c+wm1RjAlowp3KJldmFsdWVEAAARMGZidWNrZXRQJFJl9DLxbnMm1RjAlowp3GlvcGVyYXRpb25paGlzdG9ncmFt",
      "key_id": "d5f32b96-abd5-4ee5-ae23-26490d834012",
      "payload": "0s9mYVIuznK4WRV/t7uHKquHPYCpAN9mZHsUGNiYd2G/9cg87Y0IjlmZkEtiJghMT7rmg3GtWVPWTJU5MvtScK3HK3qR2W8CVDmKRAhqqlz1kPZfdGUB4NsXGyVCy2UWapklE/r7pmRDDP48b4sQTyDMFExQGUTE56M/8WFVQ0qkc7UMoLI/uwh2KeIweQCEKTzw"
    }
  ],
  "shared_info": "{\"api\":\"attribution-reporting\",\"attribution_destination\":\"https://advertiser.example\",\"debug_mode\":\"enabled\",\"report_id\":\"4a04f0ff-91e7-4ef6-9fcc-07d000c20495\",\"reporting_origin\":\"https://adtech.example\",\"scheduled_report_time\":\"1669888617\",\"source_registration_time\":\"1669852800\",\"version\":\"0.1\"}",
  "source_debug_key": "647775351539539",
  "trigger_debug_key": "156477391437535"
}
Set up verbose debug reports
Step 3: Opt into verbose debugging in the source and trigger headers
Set debug_reporting to true in both Attribution-Reporting-Register-Source
and Attribution-Reporting-Register-Trigger.
Attribution-Reporting-Register-Source:
{
// … Usual fields for Attribution-Reporting-Register-Source
"debug_key":"938321351539743",
"debug_reporting": true // defaults to false if not present
}

Attribution-Reporting-Register-Trigger:
{
// … Usual fields for Attribution-Reporting-Register-Trigger
"debug_key":"938321351539743",
"debug_reporting": true // defaults to false if not present
}
Step 4: Set up an endpoint to collect verbose debug reports
Set up an endpoint to collect the debug reports. This endpoint should be similar
to the main attribution endpoint, with an additional debug/verbose string in
the path:
https://adtech.example/.well-known/attribution-reporting/debug/verbose
When verbose debug reports are generated, that is when a source or trigger isn't
registered, the browser will immediately send a verbose debug report via a
POST request to this endpoint. Your server code to handle incoming verbose
debug reports may look as follows (here on a node endpoint):
// Handle incoming verbose debug reports
adtech.post(
  '/.well-known/attribution-reporting/debug/verbose',
  async (req, res) => {
    // List of verbose debug reports is in req.body
    res.sendStatus(200);
  }
);
Unlike success debug reports, there's only one endpoint for verbose reports. Verbose reports that relate to event-level and aggregated reports will all be sent to the same endpoint.
Demo code: verbose debug reports endpoint
Step 5: Confirm your setup will generate verbose debug reports
While there are numerous types of verbose debug reports, it's sufficient to check your verbose debugging setup with only one type of verbose debug report. If this one type of verbose debug report is correctly generated and received, this means that all types of verbose debug reports will be correctly generated and received as well, because all verbose debug reports use the same configuration and are sent to the same endpoint.
- Open
chrome://attribution-internalsin your browser. - Trigger an attribution (convert) on your site that's set up with Attribution
Reporting. Given that there was no ad engagement (impression or click)
before this conversion, you should expect a verbose debug report of type
trigger-no-matching-sourcewill be generated. - In
chrome://attribution-internals, open the Verbose debug reports tab and check that a verbose debug report of typetrigger-no-matching-sourcehas been generated. - On your server, verify that your endpoint has immediately received this verbose debug report.
Step 6: Observe verbose debug reports
Verbose debug reports generated at trigger time include both the source-side and the trigger-side debug key (if there is a matching source for the trigger). Verbose debug reports generated at source time include the source-side debug key.
Example of a request containing verbose debugs reports, sent by the browser:
[
  {
    "body": {
      "attribution_destination": "http://arapi-advertiser.localhost",
      "randomized_trigger_rate": 0.0000025,
      "report_id": "92b7f4fd-b157-4925-999e-aad6361de759",
      "source_debug_key": "282273499788483",
      "source_event_id": "480041649210491",
      "source_type": "event",
      "trigger_data": "1",
      "trigger_debug_key": "282273499788483"
    },
    "type": "trigger-event-low-priority"
  },
  {
    "body": {
      "attribution_destination": "http://arapi-advertiser.localhost",
      "limit": "65536",
      "source_debug_key": "282273499788483",
      "source_event_id": "480041649210491",
      "source_site": "http://arapi-publisher.localhost",
      "trigger_debug_key": "282273499788483"
    },
    "type": "trigger-aggregate-insufficient-budget"
  }
]
Each verbose report contains the following fields:
Type- What caused the report to be generated. To learn about all verbose report types and what action to take depending on each type, review the verbose reports reference in Part 3: Debugging cookbook.
Body- The report's body. It will depend on its type. Review the verbose reports reference in Part 3: Debugging cookbook.
A request's body will contain at least one, and at most two verbose reports:
- One verbose report if the failure only affects event-level reports (or if it only affects aggregatable reports). A source or trigger registration failure has only one reason; hence one verbose report can be generated per failure and per report type (event-level or aggregatable).
- Two verbose reports if the failure affects both event-level and aggregatable
reports—with an exception: if the failure reason is the same for event-level
and aggregatable reports, only one verbose report is generated (example:
trigger-no-matching-source)