Analytics
Stay organized with collections
Save and categorize content based on your preferences.
The Admin Console analytics page provides a detailed view into traffic on your
site. You can use the interactive charts to look at your traffic in any given
week over the past 90 days. Alternatively, you can download the data in a CSV
format.
reCAPTCHA v2

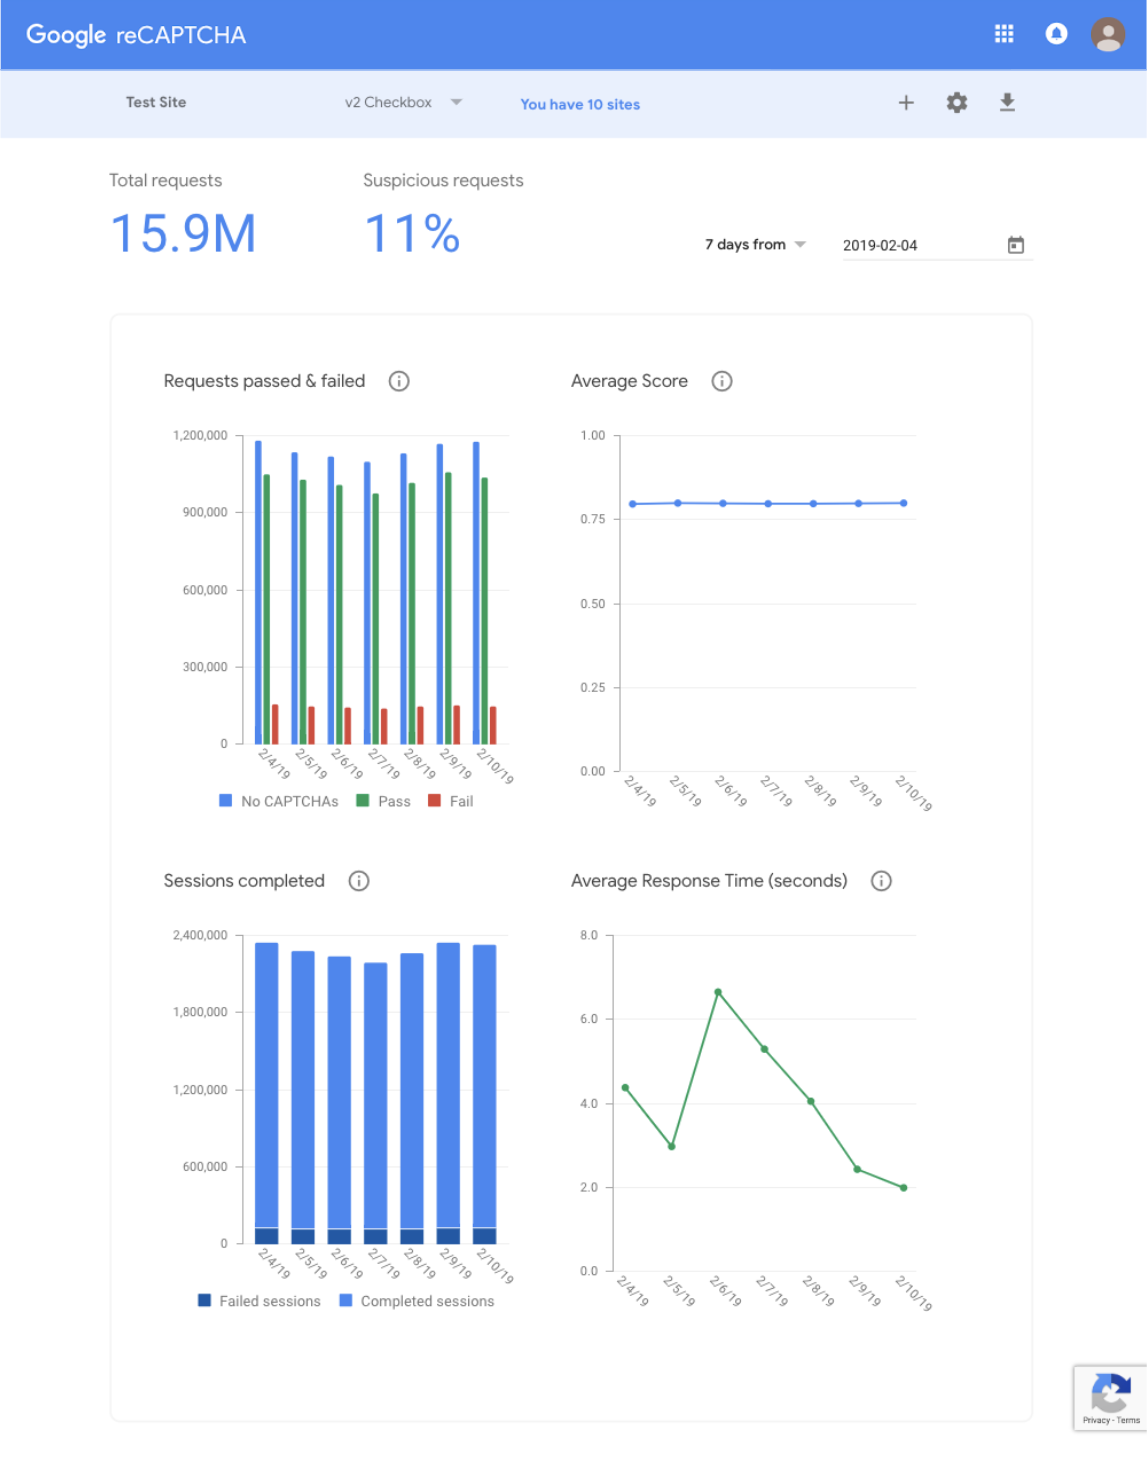
There are 4 charts available for the reCAPTCHA v2 site type. Some of the charts
might not be shown before there is sufficient traffic to your site.
Chart |
Site type |
Description |
Passed and Failed |
Checkbox, Android, Invisible |
This chart shows how many times a user or bot passed or failed an individual CAPTCHA
challenge on your site each day. The failed number does not necessarily mean the user did not
eventually solve the challenge. It also shows how many times no CAPTCHA was shown because
reCAPTCHA was confident that the request was legitimate. |
Average Score |
Checkbox, Android, Invisible |
This chart shows the average score on your site, which is designed to help you spot trends.
Scores range from 0.0 to 1.0, with 0.0 indicating abusive traffic and 1.0 indicating good
traffic. Sign up for
reCAPTCHA v3
to gain more insights about your traffic. |
Sessions Completed |
Checkbox, Android |
This chart shows how many times a user or bot interacted with reCAPTCHA and completed
reCAPTCHA verification. |
Average Response Time |
Checkbox, Android |
This chart shows the average time it took humans and bots to complete a reCAPTCHA session,
including failed attempts and reloads. |
reCAPTCHA v3

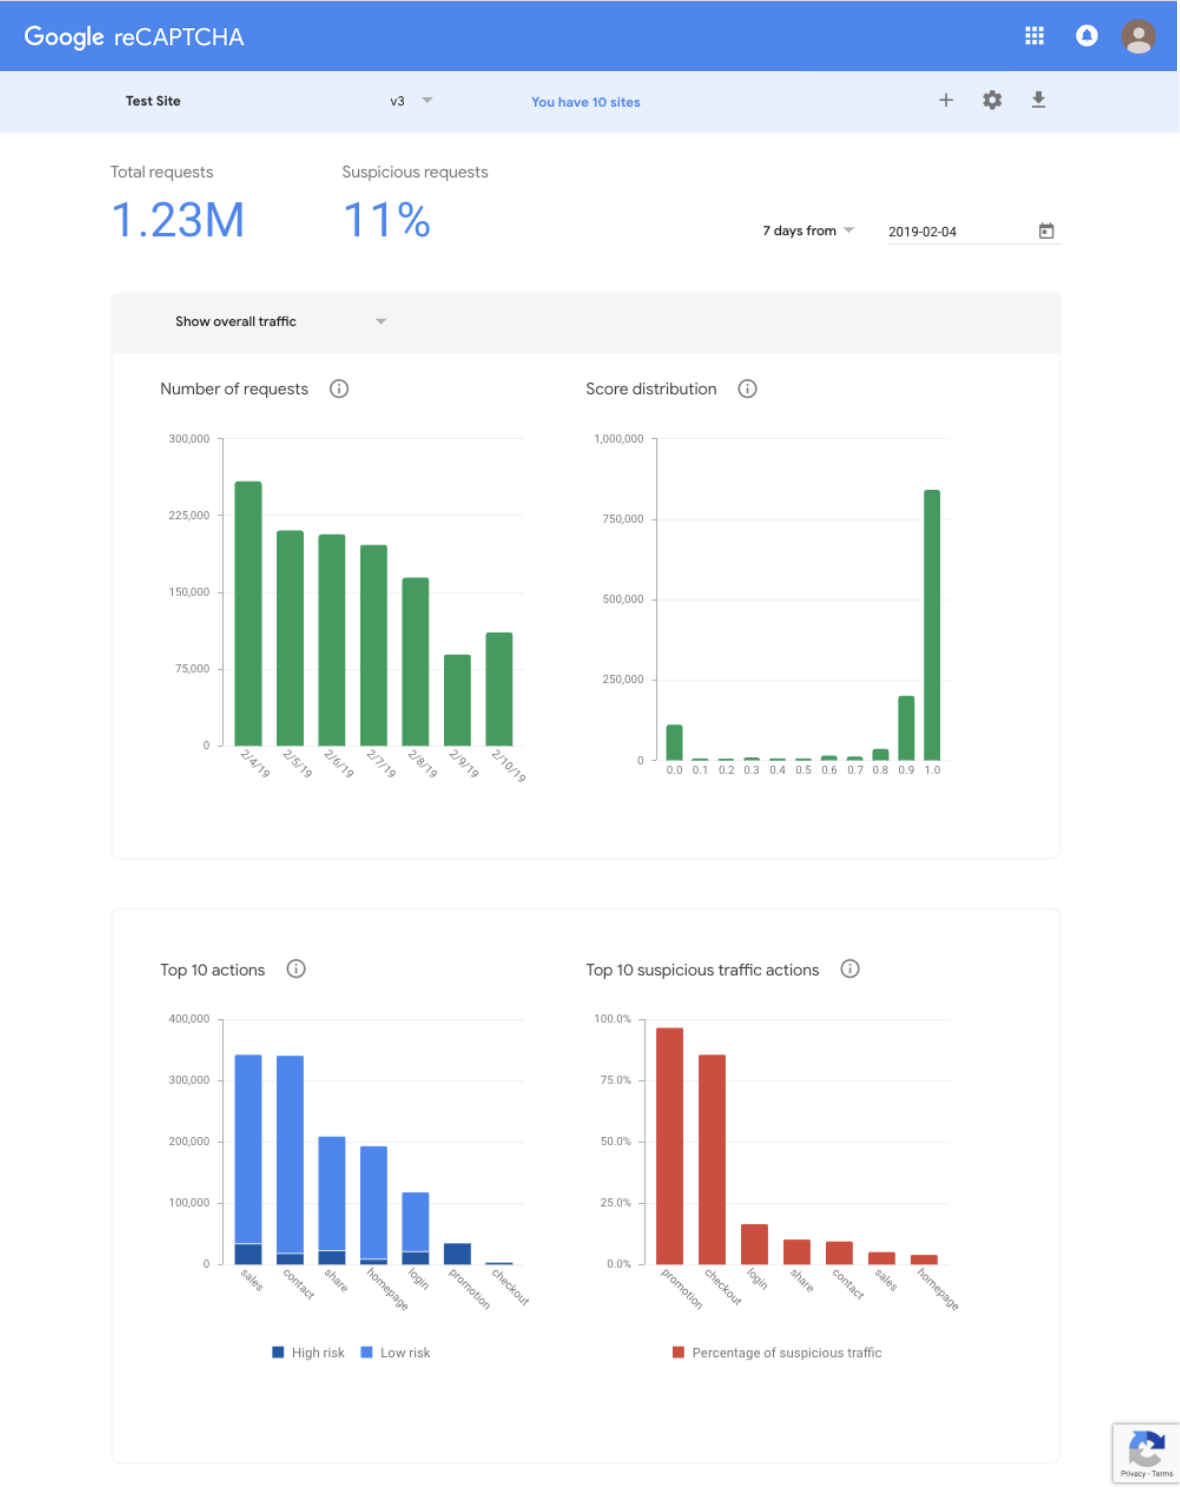
There are 4 charts available for the reCAPTCHA v3 site type. Note that the
scores may not be accurate before running with sufficient live traffic.
Chart |
Description |
Number of Requests |
This chart shows the number of requests that reCAPTCHA received from your site for the
specified action name. |
Score Distribution |
This chart shows the distribution of scores for your site for the specified action name.
Scores range from 0.0 to 1.0, with 0.0 indicating abusive traffic and 1.0 indicating good
traffic. |
Top 10 Actions |
This chart shows the top 10 actions (by overall traffic) for your site. To improve the
adaptive risk analysis for your site and to view a more detailed breakdown of your traffic,
specify an action name in each place that you execute reCAPTCHA verification. |
Top 10 Suspicious Traffic Actions |
This chart shows the top 10 actions (in descending order of percentage of suspicious
traffic) for your site. To improve the adaptive risk analysis for your site and to view a more
detailed breakdown of your traffic, specify an action name in each place that you execute
reCAPTCHA verification. |
Except as otherwise noted, the content of this page is licensed under the Creative Commons Attribution 4.0 License, and code samples are licensed under the Apache 2.0 License. For details, see the Google Developers Site Policies. Java is a registered trademark of Oracle and/or its affiliates.
Last updated 2024-07-10 UTC.
[null,null,["Last updated 2024-07-10 UTC."],[[["\u003cp\u003eThe Admin Console analytics page offers insights into website traffic using interactive charts and downloadable CSV data for the past 90 days.\u003c/p\u003e\n"],["\u003cp\u003ereCAPTCHA v2 analytics include charts for pass/fail rates, average score, sessions completed, and average response time, varying by site type.\u003c/p\u003e\n"],["\u003cp\u003ereCAPTCHA v3 analytics provide data on request numbers, score distribution, and top actions based on overall and suspicious traffic, requiring specific action names for detailed analysis.\u003c/p\u003e\n"],["\u003cp\u003eCharts might not display accurate data or be available until sufficient traffic has been processed by reCAPTCHA.\u003c/p\u003e\n"]]],["The Admin Console's analytics page provides traffic insights, allowing users to view data through interactive charts for the past 90 days or download it in CSV format. For reCAPTCHA v2, charts display passed/failed CAPTCHA challenges, average scores, completed sessions, and average response times. For reCAPTCHA v3, charts detail request numbers, score distribution, top 10 actions, and top 10 suspicious traffic actions. Specifying action names improves adaptive risk analysis.\n"],null,["# Analytics\n\nThe Admin Console analytics page provides a detailed view into traffic on your\nsite. You can use the interactive charts to look at your traffic in any given\nweek over the past 90 days. Alternatively, you can download the data in a CSV\nformat.\n\nreCAPTCHA v2\n------------\n\nThere are 4 charts available for the reCAPTCHA v2 site type. Some of the charts\nmight not be shown before there is sufficient traffic to your site.\n\n| Chart | Site type | Description |\n|-----------------------|------------------------------|---------------------------------------------------------------------------------------------------------------------------------------------------------------------------------------------------------------------------------------------------------------------------------------------------------------------------------------|\n| Passed and Failed | Checkbox, Android, Invisible | This chart shows how many times a user or bot passed or failed an individual CAPTCHA challenge on your site each day. The failed number does not necessarily mean the user did not eventually solve the challenge. It also shows how many times no CAPTCHA was shown because reCAPTCHA was confident that the request was legitimate. |\n| Average Score | Checkbox, Android, Invisible | This chart shows the average score on your site, which is designed to help you spot trends. Scores range from 0.0 to 1.0, with 0.0 indicating abusive traffic and 1.0 indicating good traffic. Sign up for [reCAPTCHA v3](/recaptcha/docs/v3) to gain more insights about your traffic. |\n| Sessions Completed | Checkbox, Android | This chart shows how many times a user or bot interacted with reCAPTCHA and completed reCAPTCHA verification. |\n| Average Response Time | Checkbox, Android | This chart shows the average time it took humans and bots to complete a reCAPTCHA session, including failed attempts and reloads. |\n\nreCAPTCHA v3\n------------\n\nThere are 4 charts available for the reCAPTCHA v3 site type. Note that the\nscores may not be accurate before running with sufficient live traffic.\n\n| Chart | Description |\n|-----------------------------------|-------------------------------------------------------------------------------------------------------------------------------------------------------------------------------------------------------------------------------------------------------------------------------------------------------|\n| Number of Requests | This chart shows the number of requests that reCAPTCHA received from your site for the specified action name. |\n| Score Distribution | This chart shows the distribution of scores for your site for the specified action name. Scores range from 0.0 to 1.0, with 0.0 indicating abusive traffic and 1.0 indicating good traffic. |\n| Top 10 Actions | This chart shows the top 10 actions (by overall traffic) for your site. To improve the adaptive risk analysis for your site and to view a more detailed breakdown of your traffic, specify an action name in each place that you execute reCAPTCHA verification. |\n| Top 10 Suspicious Traffic Actions | This chart shows the top 10 actions (in descending order of percentage of suspicious traffic) for your site. To improve the adaptive risk analysis for your site and to view a more detailed breakdown of your traffic, specify an action name in each place that you execute reCAPTCHA verification. |"]]