Page Summary
-
This superseded study compared WebP, JPEG, and JPEG 2000 compression using a dataset of 1 million images, primarily JPEGs.
-
WebP achieved an average compression percentage of 41.30% with non-negative compression gain, outperforming JPEG and JPEG 2000.
-
JPEG 2000 had lower compression percentages compared to JPEG in some cases due to negative compression for many images.
-
WebP provided particularly significant file size reduction for smaller images, which are most common on the web.
-
The study used an earlier version of WebP and a new study with lossless images as source supersedes this one.
Comparative study of WebP, JPEG and JPEG 2000, September 2010
Note: We had conducted this initial study with the first version of WebP
that we released, which used the libvpx library. In addition, the source
images were JPEG images that we crawled from the Web. Based on feedback from
the community, we have now undertaken a
new study with version 0.1.2 of libwebp
starting with lossless images (PNG) as source. The new study supersedes this
study.
The WebP team performed a comparative study of three image compression methods over a random set of 1 million images. The goals of the study were to measure the compression achieved by those methods and to analyze the trade-offs between image sizes and compression.
Three compression methods, WebP, JPEG 2000 and Re-JPEG, were applied to the 900,000 JPEG images contained in the data set. JPEG images were re-compressed with Re-JPEG so that each was as close as possible to a target peak signal-to-noise ratio (PSNR) value. The team's analysis was done on the images after they had been compressed.
In addition to the large scale study, the team manually inspected 100 random images and found that, in most cases, WebP provides acceptable visual quality.
Conclusions
WebP achieves overall higher compression than either JPEG or JPEG 2000. Gains in file size minimization are particularly high for smaller images which are the most common ones found on the web.
Data Set
The data set used in the study was a collection of 1 million images randomly sampled from a repository of images crawled from the web. The following table shows the distribution of different types of images in the data set.
| Type | Count |
|---|---|
| JPEG | ~900K |
| PNG | ~47K |
| GIF | ~47K |
| Other | ~6K |
Experiment Design
The experiments were run in two stages:
The team ran WebP on the images with a target PSNR of 42. They tuned the quality parameter (QP) for the WebP encoder until they achieved a result that was as close to 42 as they could get for a given image. The actual PSNR achieved for each image, therefore, was not necessarily exactly 42.
The team used the PSNR value for the WebP-compressed images as the target PSNR for the JPEG 2000 and Re-JPEG images. They also performed a line search over the quality parameters of the JPEG 2000 and JPEG images in order to come as close as possible to the target PSNR.
The actual compression result was measured as a percentage using the following formula:
compression_percentage = 100 * (original_image.length - compressed_image.length) / original_image.length
Results
The tests yielded the following results for negative and non-negative compression gain:
Non-negative Compression Gain
The team did not penalize a method if that method increased the image size after compression. That is, the compression_percentage was considered to be 0 when compressed_image.length was greater than the original_image.length.
Negative Compression Gain
The team allowed negative compression percentage results to get a better understanding of the various compressors' raw performance.
Following are the average compression percentages that were achieved by each of the three methods.
| Type | Avg PSNR Obtained | Avg Compression % (non-negative compression gain) |
Avg Compression % (negative compression gain) |
|---|---|---|---|
| WebP | 39.38 | 41.30 | 39.80 |
| JPEG 2000 | 39.49 | 27.67 | 9.71 |
| Re-JPEG | 39.36 | 22.37 | 14.62 |
When negative compression gain was allowed, the average performance for JPEG 2000 was lower than that of JPEG. This may be due to high-frequency artifacts present in the JPEG images; these artifacts can contribute to a less-than-ideal compression situation.
The Kakadu implementation used in the experiment to convert to JPEG 2000 failed to convert approximately 240,000 images.
JPEG 2000 had lower compression percentages than Re-JPEG, primarily because the JPEG 2000 result was negative compression for many images. For that reason, JPEG images achieved a lower overall compression score.
The following figures provide distribution graphs for the three methods:
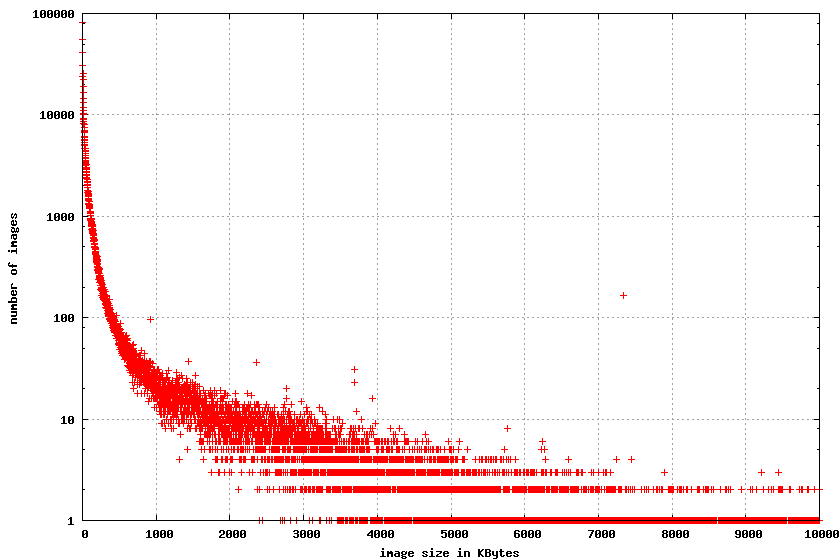
Figure 1: Image Size Population Distribution

The graph shows that most of the images were small. The frequency of the images with a size more than 500K is generally less than 100.
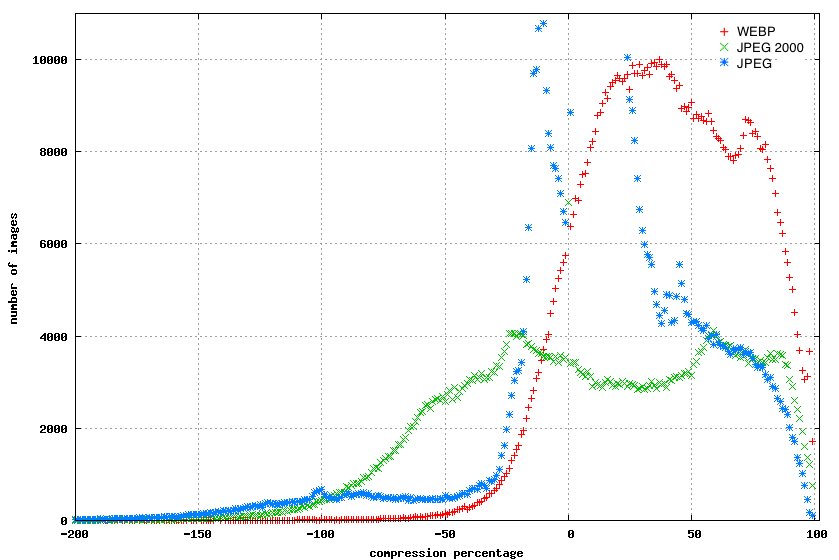
Figure 2: Compression Percentages for WebP, JPEG, and JPEG 2000 Images

This graph demonstrates that the body of pictures compressed with WebP got better compression than re-jpeg and jpeg 2000. Also, the pictures compressed with WebP got more positive compression than the others.
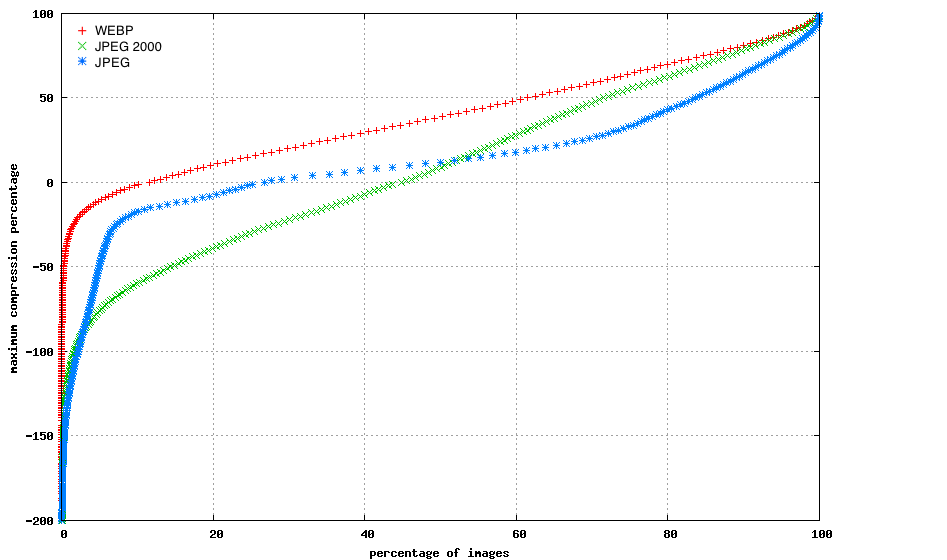
Figure 3: Comparison of Image Sizes and Compression Percentage

This graph shows that WebP achieves better compression than the other formats, particularly for smaller images.
