Page Summary
-
The Monitoring API leverages the
addEventCallbackmethod to monitor tag behavior and performance, allowing you to track tag status, execution times, and custom metadata. -
You can collect data by sending monitoring pixels to a chosen endpoint containing information like tag success/failure rates, execution times, or specific tag metadata.
-
Tag metadata can be added to tags to enable more granular monitoring by categorizing or grouping tags for targeted analysis.
-
This collected data can be used to build monitoring dashboards, trigger alert systems, or gain insights into tag performance within your Google Tag Manager container.
The Monitoring API allows you to build tools to monitor the behavior and performance of your tags. This is done via the addEventCallback Custom Template API method. This method allows you to specify an event callback which will be invoked at the end of an event. This callback will receive information about the event, which allows you to create your own tag monitoring implementations. You can also add metadata to your tags to allow for more fine-grained monitoring.
The Monitoring API can support several monitoring use cases such as tag status, execution times and metadata. The end goal of these monitoring pixels is to send data to an endpoint of your choosing. Logs from this endpoint can then be accessed to collect monitoring data, and that data can then be displayed in a dashboard or used to trigger an alert system.
Tag status
The tag status technique shown in this example uses addEventCallback to tally the firing status of tags on a page. This will loop over all the tags that fired for the event and count the number of tags that succeeded, failed, threw an exception, or timed out. These totals are then added to the monitoring pixel URL as query parameters. The monitoring pixel will have a URL similar to this:
https://www.example.com/monitoring?ctid=GTM-XXXXXX&success=4&failure=1&exception=1&timeout=0
The pixel URL can be set up using the following code example:
const addEventCallback = require('addEventCallback');
const sendPixel = require('sendPixel');

addEventCallback(function(containerId, eventData) {
  let successCount = 0;
  let failureCount = 0;
  let exceptionCount = 0;
  let timeoutCount = 0;

  const tagData = eventData['tags'];
  const timingData = [];
  for (let i in tagData) {
    let entry  = tagData[i];
    switch (entry.status) {
      case 'success':
        successCount++;
        continue;
      case 'failure':
        failureCount++;
        continue;
      case 'exception':
        exceptionCount++;
        continue;
      case 'timeout':
        timeoutCount++;
        continue;
    }
  }
  let url = 'https://www.example.com/monitoring?ctid=' + containerId +
      '&success=' + successCount +
      '&failure=' + failureCount +
      '&exception=' + exceptionCount +
      '&timeout=' + timeoutCount;
  sendPixel(url);
});
data.gtmOnSuccess();
Execution times
This technique uses addEventCallback to help you collect data about the execution times of your tags. For every tag that fired for this event, a query parameter is added to the pixel URL that includes the tag's ID and execution time. This sends a pixel that resembles the following:
https://www.example.com/monitoring?ctid=GTM-XXXXXX&tag12=1200&tag50=400&tag1=6000
The pixel URL can be set up using the following code example:
const addEventCallback = require('addEventCallback');
const sendPixel = require('sendPixel');

addEventCallback(function(containerId, eventData) {
  let url = 'https://www.example.com/monitoring?ctid=' + containerId;
  const tagData = eventData['tags'];
  const timingData = [];
  for (let i in tagData) {
    let entry = tagData[i];
    timingData.push('&tag' + entry['id'] + '=' + entry['executionTime']);
  }
  url += timingData.join('');
  sendPixel(url);
});
data.gtmOnSuccess();
Metadata
You can build useful dashboards using the base data provided by the Monitoring API. However, there may be cases where you may want to monitor only a subset of tags. To facilitate this, use the Tag Metadata section to specify arbitrary key value pairs in a tag definition. These values will be included in the event data object when an event callback occurs.
For example: A tag is added to a container for a new ad campaign. The container has many existing tags, but you are only interested in monitoring this new tag.
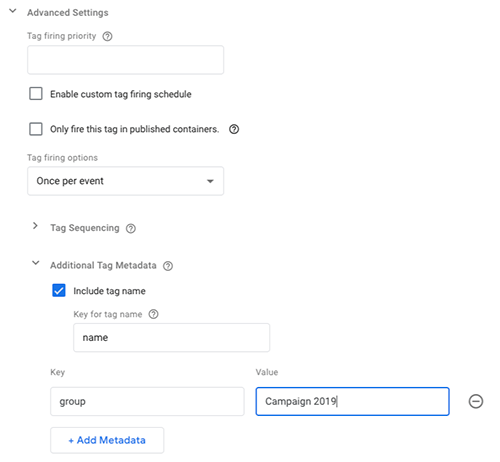
To identify this tag from an event callback, add metadata to the tag:
- In the tag definition, click Advanced Settings > Additional Tag Metadata.
- Click Include Tag Name so that it is checked.
- In Key for tag name, enter a value. This example uses "name" as the value. This will include the tag name in the event data as it is sent.
- Click +Add Metadata and enter a Key and Value pair. This example uses a Key called "group" and a Value of "Campaign 2019".
- Use +Add Metadata to add additional rows of key/value pairs, as desired.

In a custom template, the developer can identify this tag by checking for the values set in metadata:
const addEventCallback = require('addEventCallback');
const sendPixel = require('sendPixel');

addEventCallback(function(containerId, eventData) {
  let url = 'https://www.example.com/monitoring/campaignPixel?ctid=' + containerId;
  const tagData = eventData['tags'];
  for (let i in tagData) {
    let entry = tagData[i];
    if (entry['name'] === 'Conversion Pixel 2019') {
      url += '&status=' + entry['status'];
      break;
    }
  }
  sendPixel(url);
});
data.gtmOnSuccess();
This results in a pixel URL that resembles the following:
https://www.example.com/monitoring/campaignPixel?ctid=GTM-XXXXXX&status=success
If desired, you can then monitor all the tags for the "Campaign 2019" group:
const addEventCallback = require('addEventCallback');
const encode = require('encodeUriComponent');
const sendPixel = require('sendPixel');

addEventCallback(function(containerId, eventData) {
  let url = 'https://www.example.com/monitoring/campaign2019?ctid=' + containerId;
  const tagData = eventData['tags'];
  for (let i in tagData) {
    let entry = tagData[i];
    if (entry['group'] === 'Campaign 2019') {
      url += '&' + encode(entry['name']) + '=' + entry['status'];
      break;
    }
  }
  sendPixel(url);
});
data.gtmOnSuccess();
This would result in a monitoring pixel similar to the following:
https://www.example.com/monitoring/campaign2019?ctid=GTM-XXXXXX&Conversion%20Pixel%202019=failure