ניפוי באגים באפליקציית האינטרנט של לוח הציור האינטראקטיבי באמצעות כלי הפיתוח ל-Chrome
קל לארגן דפים בעזרת אוספים
אפשר לשמור ולסווג תוכן על סמך ההעדפות שלך.
אפשר לנפות באגים באפליקציית האינטרנט של לוח הציור האינטראקטיבי באמצעות כלי הפיתוח ל-Chrome. הכלי לניפוי באגים של Chrome נתמך במסכים חכמים של Google Home או Google Nest עם גרסת תוכנה 30 ואילך (העדכון הזה יושק באוקטובר 2020)
וגרסת קושחה 1.50 ואילך של קושחה. אפשר לבדוק את הגרסאות בקטע System settings / About device במסך החכם.
הגדרת הסביבה
כדי לנפות באגים, צריך לבצע את הפעולות הבאות כדי להגדיר את הסביבה באופן תקין:
מפעילים את הפעולה לבדיקה בסימולטור של מסוף Actions.
מחברים את המכונה לאותה רשת תקשורת מקומית שאליה מחובר מכשיר Google Home או Google Nest שבודקים.
מוודאים שהרשת לא חוסמת חבילות בין מכשירים.
מתחברים לאותו חשבון Google בקונסולה ל-Actions
ובמכשיר Google Home או Google Nest.
ברגע שהסביבה תהיה מוכנה, תוכלו להפעיל את הפעולה במסך החכם לבדיקה.
קישור אפליקציית האינטרנט של Canvas לכלי לניפוי באגים
כדי לחבר את אפליקציית האינטרנט של Canvas לכלי לניפוי הבאגים של כלי הפיתוח ל-Chrome:
בשדה הכתובת בדפדפן Chrome, הזינו chrome://inspect#devices כדי להפעיל את הכלי לבדיקת Chrome. בדף אמורה להופיע רשימת מכשירים, וכתובת האתר של ה-HTML של לוח הציור אמורה להופיע מתחת לשם של מכשיר Google Home או Google Nest לבדיקה. שימו לב: יכול להיות שיעבור קצת זמן עד
ש-Chrome יגלה את כל המכשירים ברשת שלכם.
לוחצים על הקישור inspect שמתחת לכתובת ה-URL של ה-HTML כדי להפעיל את כלי הפיתוח ל-Chrome.
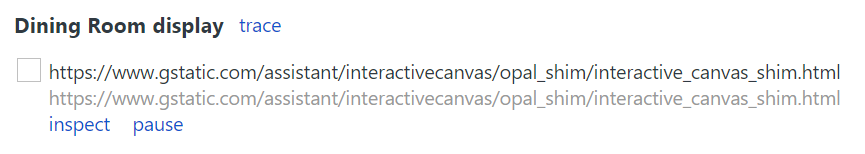
כלי הפיתוח ל-Chrome נטענים בחלון משלהם. תוכלו ללחוץ על הלחצן של הקלטת המסך
()
כדי לראות את ממשק ה-GUI לאינטרנט שעבר רינדור במכשיר. בצילום המסך הבא אפשר לראות איך אפליקציית האינטרנט מופיעה בכלי הפיתוח ל-Chrome:
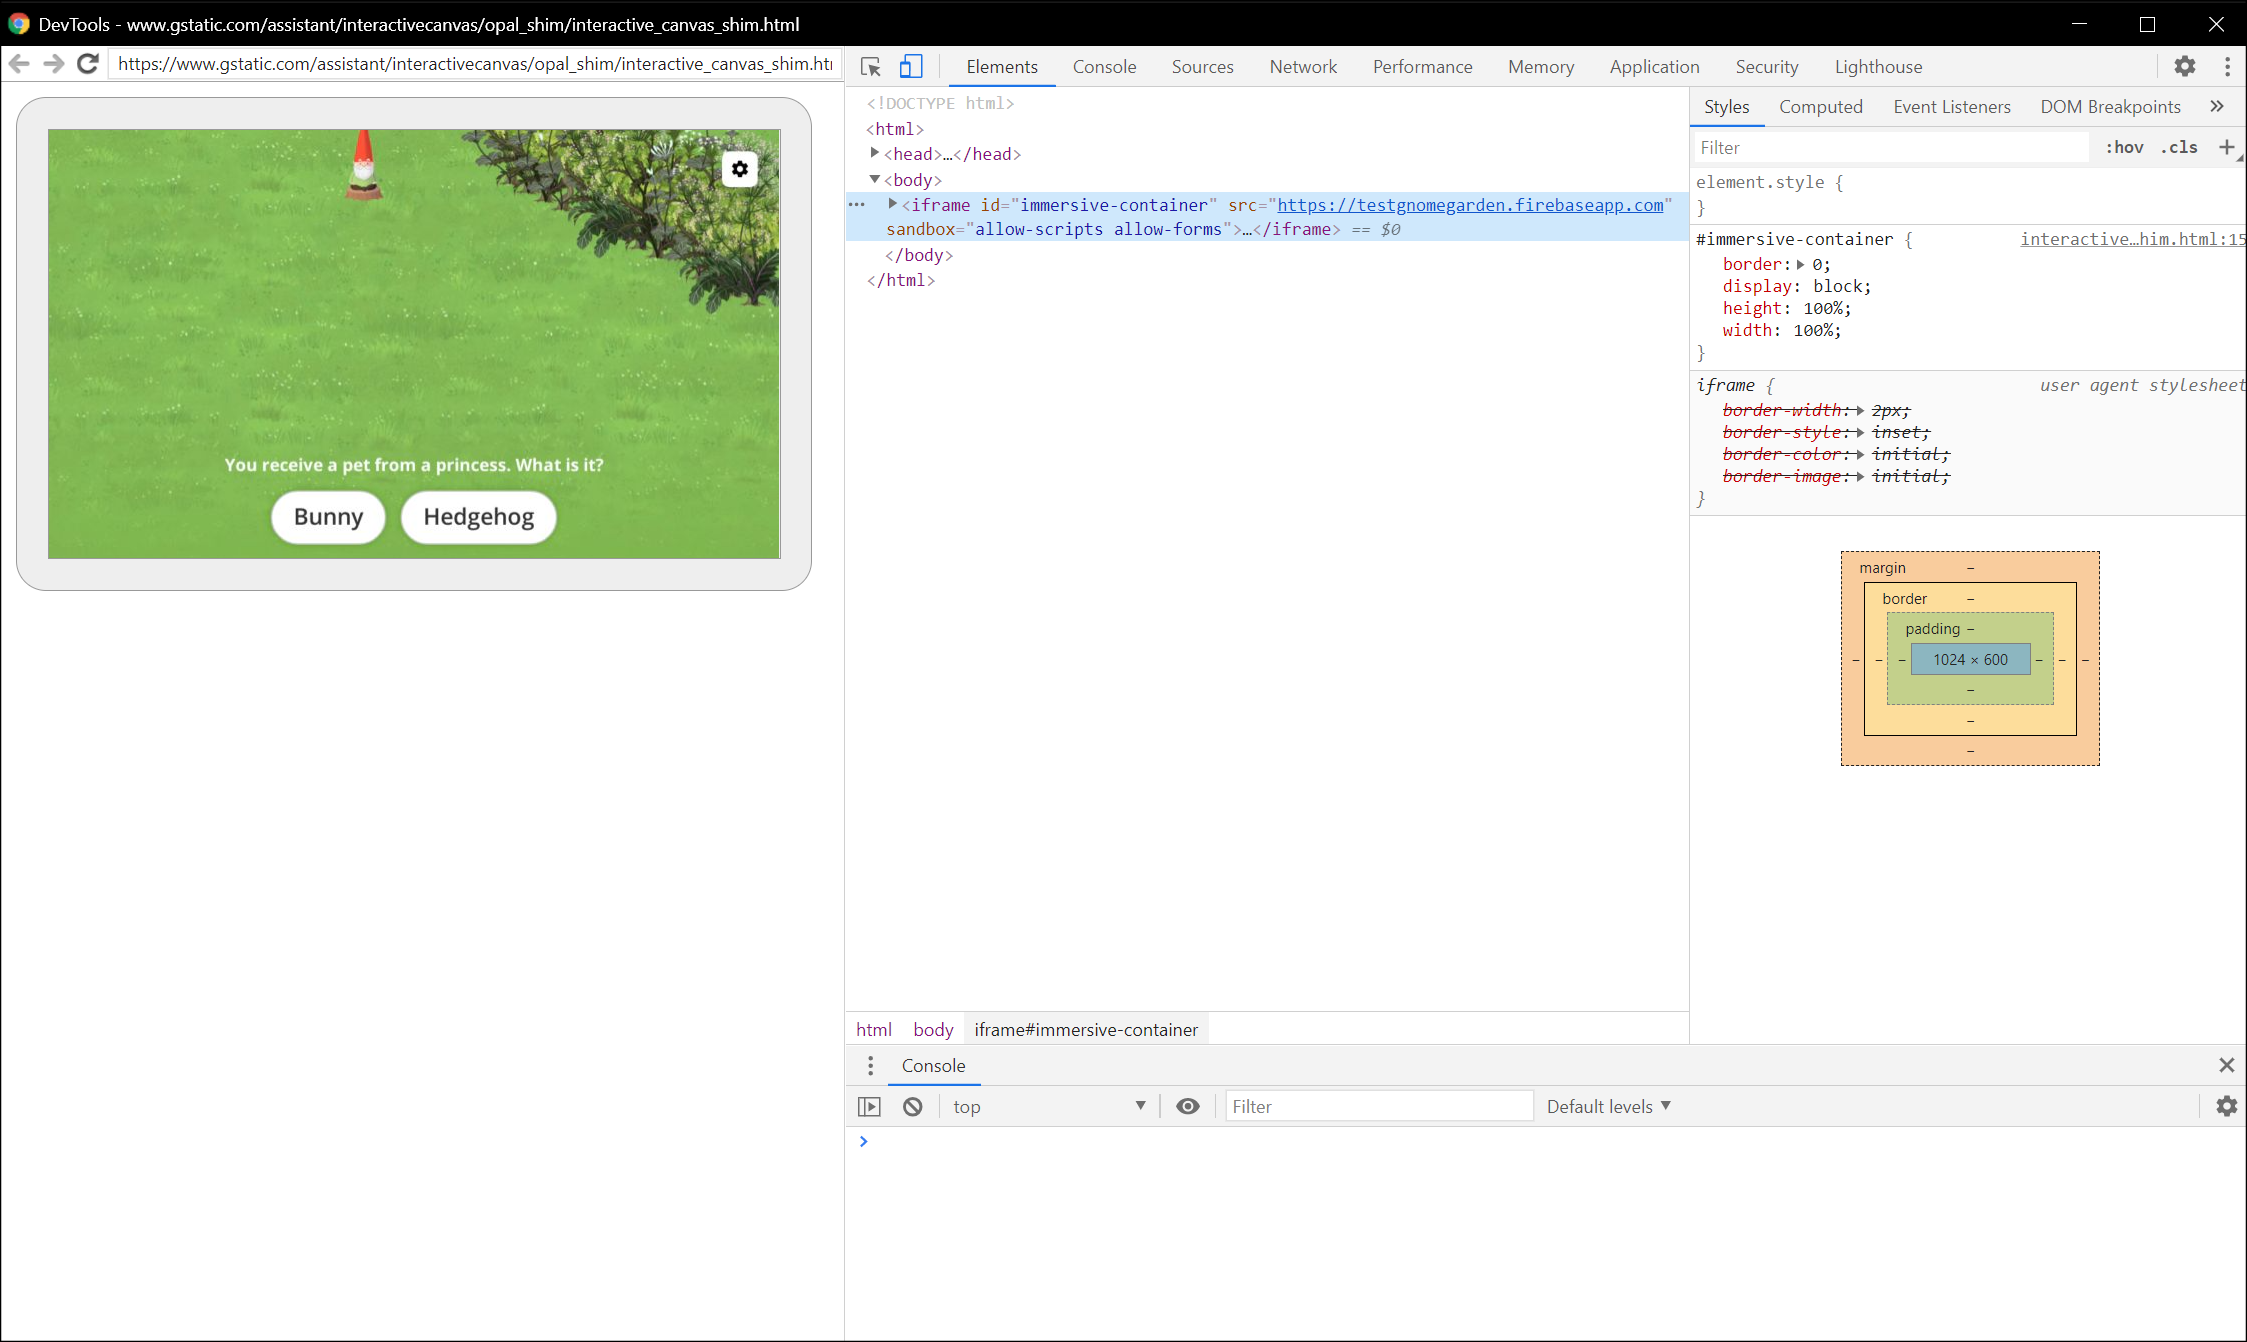
חשוב לדעת שאפליקציית האינטרנט של לוח הציור נטענת ב-iframe.
טיפים לניפוי באגים
במהלך ניפוי הבאגים, כדאי להביא בחשבון את הטיפים הבאים:
צריך לרענן את הדף ב-Chrome DevTools כדי לטעון מחדש את מאגר האפליקציות למילוי הזמנות מקומי עם הקוד העדכני ביותר מכתובת ה-URL לפיתוח.
בודקים שאפליקציית JavaScript נטענת ללא שגיאות. לשם כך, צריך לבדוק את הקטע 'מסוף' בדף של כלי הפיתוח.
אפשר להוסיף נקודות עצירה באופן ידני לקוד באמצעות debugger; בקוד של אפליקציית האינטרנט.
אם המכשיר לא מופיע ב-chrome://inspect#devices לפרק זמן ארוך, צריך לרענן את הדף 'בדיקה'.
מכיוון שזיכרון התצוגה החכמה מוגבל, אפליקציית האינטרנט שלכם עלולה לקרוס או להיתקע אם היא תחרוג מ-200MB. כדי לנפות באגים בבעיות זיכרון, כדאי לפעול לפי המדריך לפתרון בעיות זיכרון.
אם יש שגיאות במילוי הבקשה, בודקים את הבקשות שנשלחות מהשרתים של Actions on Google ל-webhook מיומני ה-webhook או מיומני Stackdriver.
[null,null,["עדכון אחרון: 2025-07-25 (שעון UTC)."],[[["\u003cp\u003eDebug your Interactive Canvas web app using Chrome DevTools on Google Home or Nest smart displays running supported software and firmware versions.\u003c/p\u003e\n"],["\u003cp\u003eSet up your environment by enabling your Action for testing, connecting devices to the same network, ensuring network connectivity, and using the same Google account.\u003c/p\u003e\n"],["\u003cp\u003eConnect to the debugger by launching Chrome Inspector, locating your device and Canvas HTML URL, and clicking "inspect" to open DevTools.\u003c/p\u003e\n"],["\u003cp\u003eUtilize debugging tips such as refreshing the DevTools page, checking for JavaScript errors, adding breakpoints, and monitoring performance and memory usage.\u003c/p\u003e\n"],["\u003cp\u003eThird-party smart display devices are not supported for debugging Canvas web apps.\u003c/p\u003e\n"]]],[],null,["# Debug your Interactive Canvas web app with Chrome DevTools\n\nYou can debug your Interactive Canvas web app using [Chrome DevTools](https://developers.google.com/web/tools/chrome-devtools). The Chrome debugger\nis supported on Google Home or Google Nest smart displays with a software\nversion of 30 or later (this update starts rolling out in October 2020)\nand a Cast firmware version of 1.50 or later. You can\ncheck the versions under `System settings / About device` on your smart display.\n| **Note:** Debugging Canvas web apps on third-party smart display devices is not supported.\n\nSet up your environment\n-----------------------\n\nBefore you can debug, do the following to set up your environment correctly:\n\n- Enable your Action for testing in the Actions console [simulator](/assistant/conversational/build/projects#test_projects_in_the_simulator).\n- Connect your machine to the same local area network as the Google Home or Google Nest device you are testing.\n- Ensure that your network doesn't block packets between devices.\n- Log in with the same Google account on the Actions console and on the Google Home or Google Nest device.\n\nOnce your environment is ready, you can launch your Action on your test\nsmart display.\n| **Note:** You cannot debug your Canvas web app until you've launched your development Action on your test smart display.\n\nConnect Canvas web app to debugger\n----------------------------------\n\nTo connect your Canvas web app to the Chrome DevTools debugger, follow these\nsteps:\n\n1. In your local development machine, install and launch the [Google Chrome browser](https://www.google.com/chrome/).\n2. In the address field of your Chrome browser, enter `chrome://inspect#devices` to launch the Chrome inspector. You should see a list of devices on the page, and the Canvas HTML URL should be listed under the name of your test Google Home or Google Nest device. Note that it might take some time for Chrome to discover all the devices on your network.\n3. Click the `inspect` link under the HTML URL to launch Chrome DevTools.\n\nChrome DevTools loads in its own window. You can click the screencast\n()\nbutton to see the web GUI rendered on the device. The following screenshot shows\nhow your web app appears in Chrome DevTools:\n\nNote that your Canvas web app is loaded in an iframe.\n\nDebugging tips\n--------------\n\nKeep the following additional tips in mind during debugging:\n\n- Refresh the page in Chrome DevTools to reload your local fulfillment app container with the latest code from your development URL.\n- Check that your JavaScript app loads without errors. To do this, check the console section of the DevTools page.\n- Add manual breakpoints to your code by using `debugger;` within your web app code.\n- If you don't see your device in the `chrome://inspect#devices` for an extended period of time, refresh the inspect page.\n- To debug any performance issues, follow the [Get Started with Analyzing Runtime Performance tutorial](https://developers.google.com/web/tools/chrome-devtools/evaluate-performance).\n- Because the smart display memory is limited, your web app might crash or hang if it goes over 200MB. To debug any memory issues, follow the [Fix Memory Problems tutorial](https://developers.google.com/web/tools/chrome-devtools/memory-problems).\n- For any fulfillment errors, look at requests sent by Actions on Google servers to the webhook from your webhook logs or from Stackdriver logs."]]