Page Summary
-
You can debug your Interactive Canvas web app using Chrome DevTools on supported Google Home or Google Nest smart displays with the correct software and firmware versions.
-
Before debugging, ensure your environment is set up correctly by enabling your Action for testing, connecting your machine to the same network as the device, and logging in with the same Google account.
-
To connect your Canvas web app to the debugger, use
chrome://inspect#devicesin your Chrome browser and click theinspectlink under your device's HTML URL. -
Debugging tips include refreshing the page to reload code, checking for JavaScript errors in the console, adding breakpoints, refreshing the inspect page if the device isn't visible, and using performance and memory tools for analysis.
-
Be mindful of memory limitations on smart displays, as exceeding 200MB can cause your web app to crash or hang.
You can debug your Interactive Canvas web app using Chrome DevTools. The Chrome debugger
is supported on Google Home or Google Nest smart displays with a software
version of 30 or later (this update starts rolling out in October 2020)
and a Cast firmware version of 1.50 or later. You can
check the versions under System settings / About device on your smart display.
Set up your environment
Before you can debug, do the following to set up your environment correctly:
- Enable your Action for testing in the Actions console simulator.
- Connect your machine to the same local area network as the Google Home or Google Nest device you are testing.
- Ensure that your network doesn’t block packets between devices.
- Log in with the same Google account on the Actions console and on the Google Home or Google Nest device.
Once your environment is ready, you can launch your Action on your test smart display.
Connect Canvas web app to debugger
To connect your Canvas web app to the Chrome DevTools debugger, follow these steps:
- In your local development machine, install and launch the Google Chrome browser.
- In the address field of your Chrome browser, enter
chrome://inspect#devicesto launch the Chrome inspector. You should see a list of devices on the page, and the Canvas HTML URL should be listed under the name of your test Google Home or Google Nest device. Note that it might take some time for Chrome to discover all the devices on your network. - Click the
inspectlink under the HTML URL to launch Chrome DevTools.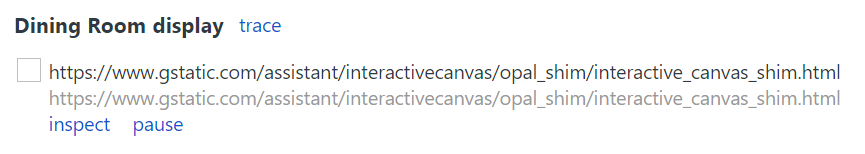
Chrome DevTools loads in its own window. You can click the screencast
(![]() )
button to see the web GUI rendered on the device. The following screenshot shows
how your web app appears in Chrome DevTools:
)
button to see the web GUI rendered on the device. The following screenshot shows
how your web app appears in Chrome DevTools:
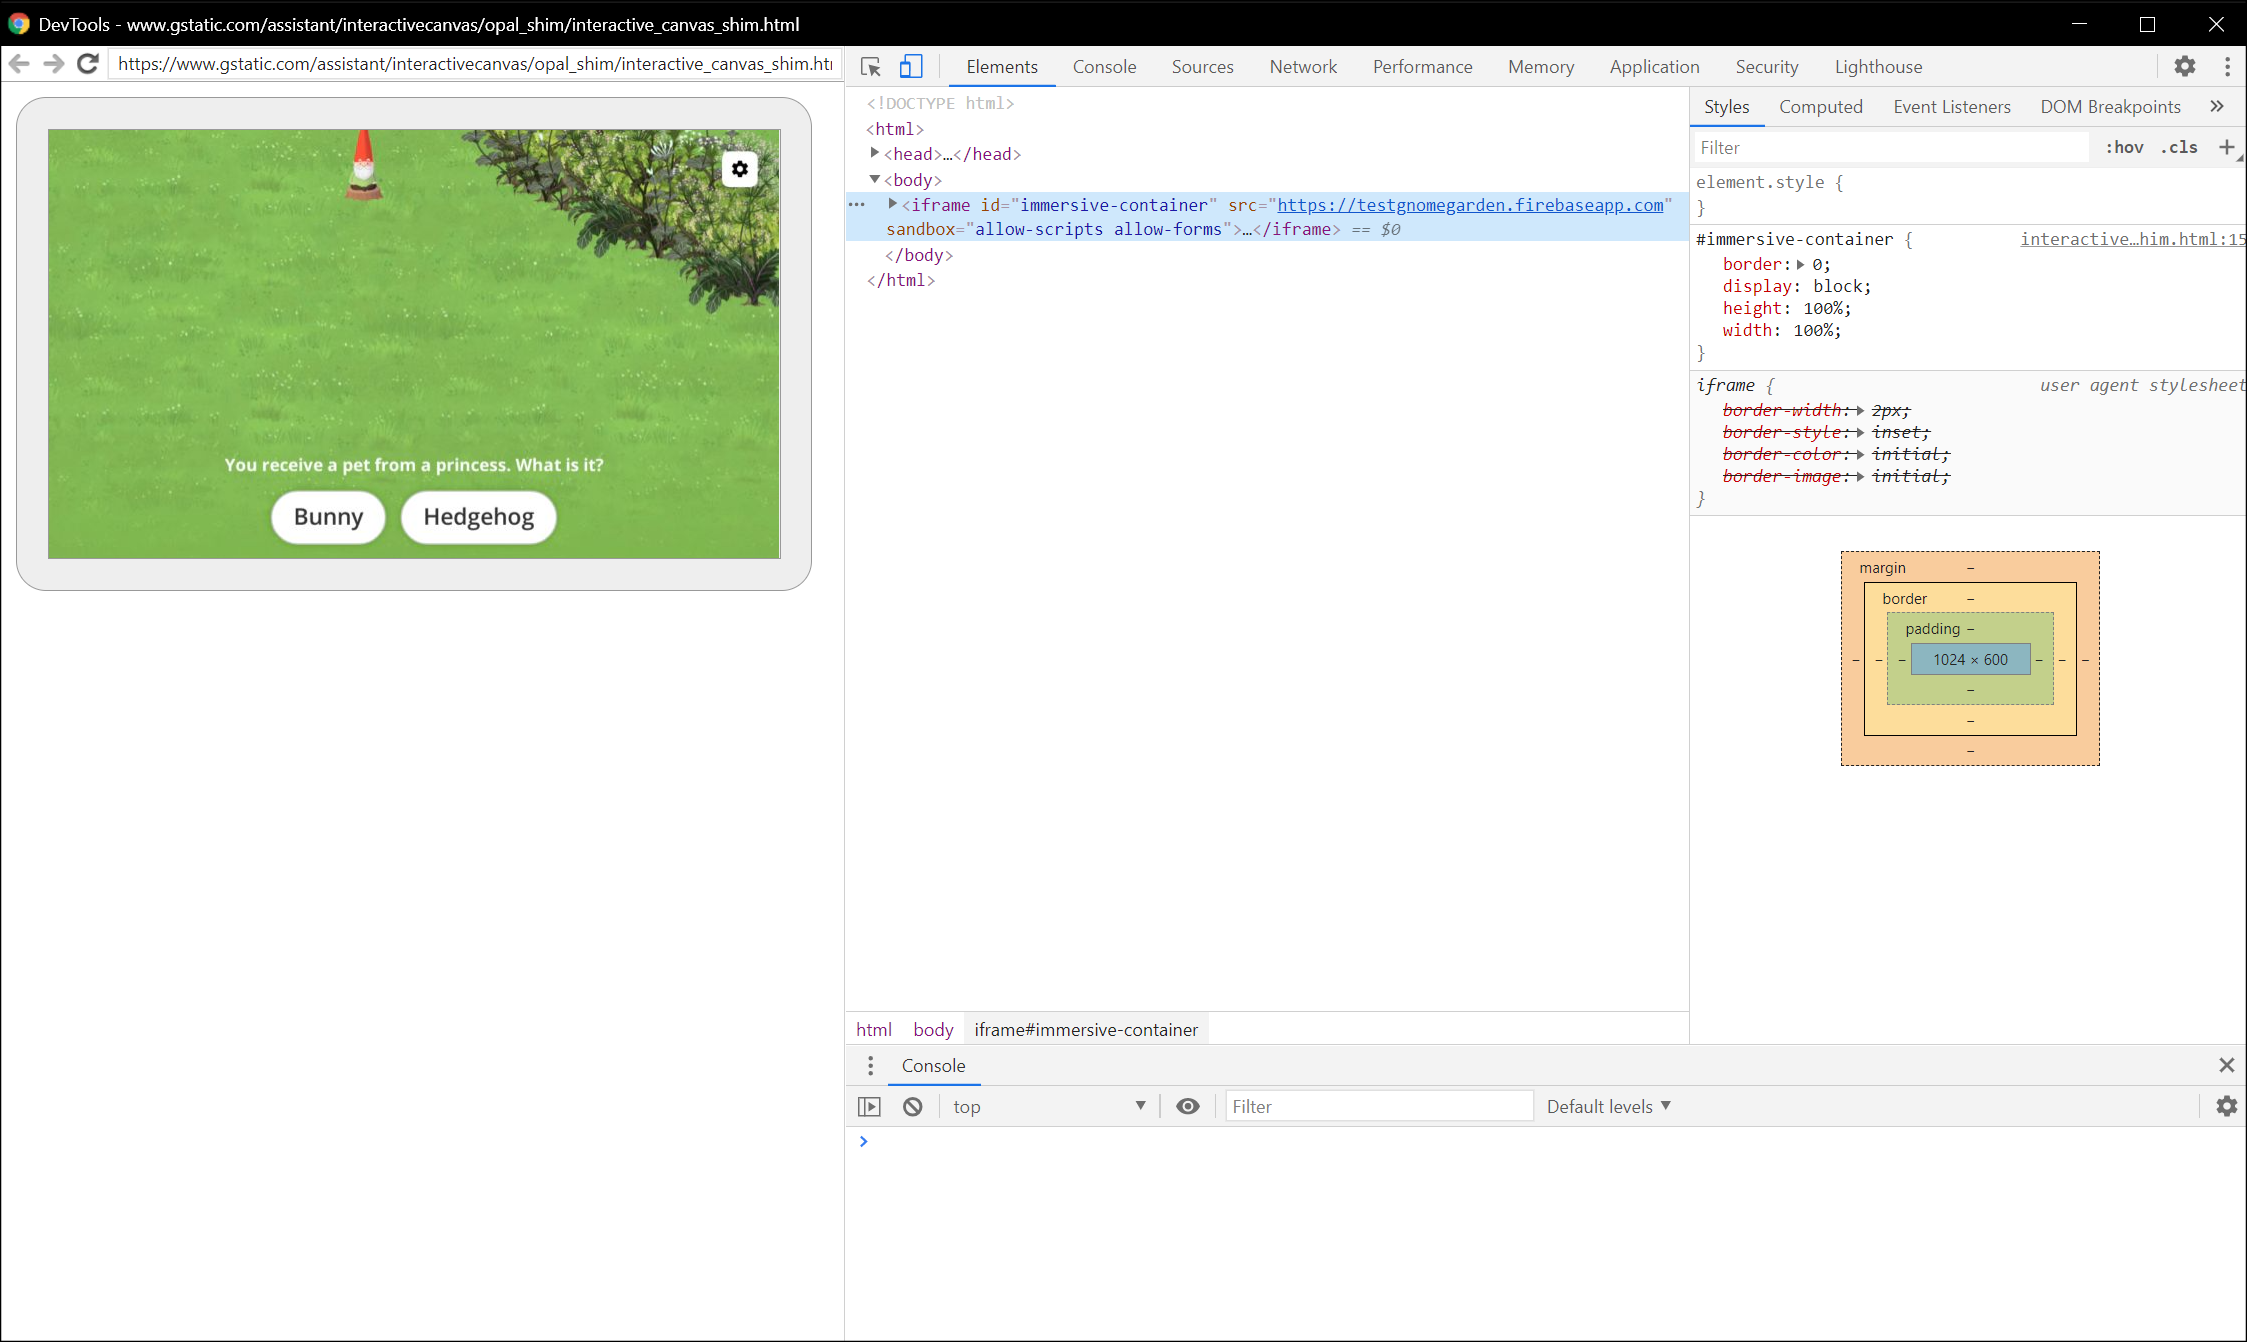
Note that your Canvas web app is loaded in an iframe.
Debugging tips
Keep the following additional tips in mind during debugging:
- Refresh the page in Chrome DevTools to reload your local fulfillment app container with the latest code from your development URL.
- Check that your JavaScript app loads without errors. To do this, check the console section of the DevTools page.
- Add manual breakpoints to your code by using
debugger;within your web app code. - If you don’t see your device in the
chrome://inspect#devicesfor an extended period of time, refresh the inspect page. - To debug any performance issues, follow the Get Started with Analyzing Runtime Performance tutorial.
- Because the smart display memory is limited, your web app might crash or hang if it goes over 200MB. To debug any memory issues, follow the Fix Memory Problems tutorial.
- For any fulfillment errors, look at requests sent by Actions on Google servers to the webhook from your webhook logs or from Stackdriver logs.