Kể từ ngày 13 tháng 6 năm 2023, Hành động trò chuyện không còn được dùng nữa. Để biết thêm thông tin, hãy xem phần Hành động trò chuyện ngừng hoạt động.
Gỡ lỗi ứng dụng web Canvas tương tác bằng Công cụ của Chrome cho nhà phát triển
Sử dụng bộ sưu tập để sắp xếp ngăn nắp các trang
Lưu và phân loại nội dung dựa trên lựa chọn ưu tiên của bạn.
Bạn có thể gỡ lỗi ứng dụng web Canvas tương tác bằng cách sử dụng Công cụ của Chrome cho nhà phát triển. Trình gỡ lỗi Chrome được hỗ trợ trên màn hình thông minh Google Home hoặc Google Nest có phiên bản phần mềm 30 trở lên (bản cập nhật này bắt đầu ra mắt vào tháng 10 năm 2020) và phiên bản chương trình cơ sở Cast 1.50 trở lên. Bạn có thể kiểm tra các phiên bản trong System settings / About device trên màn hình thông minh của mình.
Thiết lập môi trường
Trước khi có thể gỡ lỗi, hãy làm như sau để thiết lập môi trường của bạn đúng cách:
Bật Hành động của bạn để kiểm thử trong trình mô phỏng của bảng điều khiển Actions.
Kết nối máy của bạn với cùng một mạng cục bộ với thiết bị Google Home hoặc Google Nest mà bạn đang kiểm thử.
Đảm bảo rằng mạng của bạn không chặn các gói tin giữa các thiết bị.
Đăng nhập bằng cùng một Tài khoản Google trên bảng điều khiển Actions và trên thiết bị Google Home hoặc Google Nest.
Sau khi môi trường đã sẵn sàng, bạn có thể chạy Hành động của mình trên màn hình thông minh kiểm thử.
Kết nối ứng dụng web Canvas với trình gỡ lỗi
Để kết nối ứng dụng web Canvas với trình gỡ lỗi Công cụ của Chrome cho nhà phát triển, hãy làm theo các bước sau:
Trong trường địa chỉ của trình duyệt Chrome, hãy nhập chrome://inspect#devices
để khởi chạy trình kiểm tra Chrome. Bạn sẽ thấy một danh sách các thiết bị trên trang và URL HTML của Canvas phải được liệt kê dưới tên của thiết bị Google Home hoặc Google Nest thử nghiệm. Xin lưu ý rằng có thể mất một chút thời gian để Chrome khám phá tất cả các thiết bị trên mạng của bạn.
Nhấp vào đường liên kết inspect bên dưới URL HTML để chạy Công cụ của Chrome cho nhà phát triển.
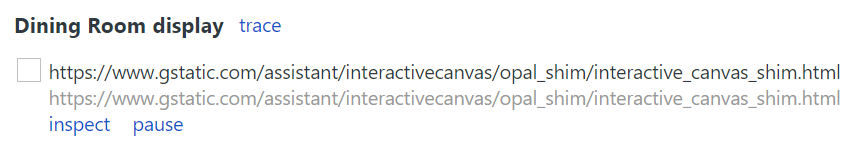
Công cụ của Chrome cho nhà phát triển tải trong cửa sổ riêng. Bạn có thể nhấp vào nút ghi màn hình () để xem GUI web (Giao diện người dùng đồ hoạ) hiển thị trên thiết bị. Ảnh chụp màn hình sau đây cho thấy cách ứng dụng web của bạn xuất hiện trong Công cụ của Chrome cho nhà phát triển:
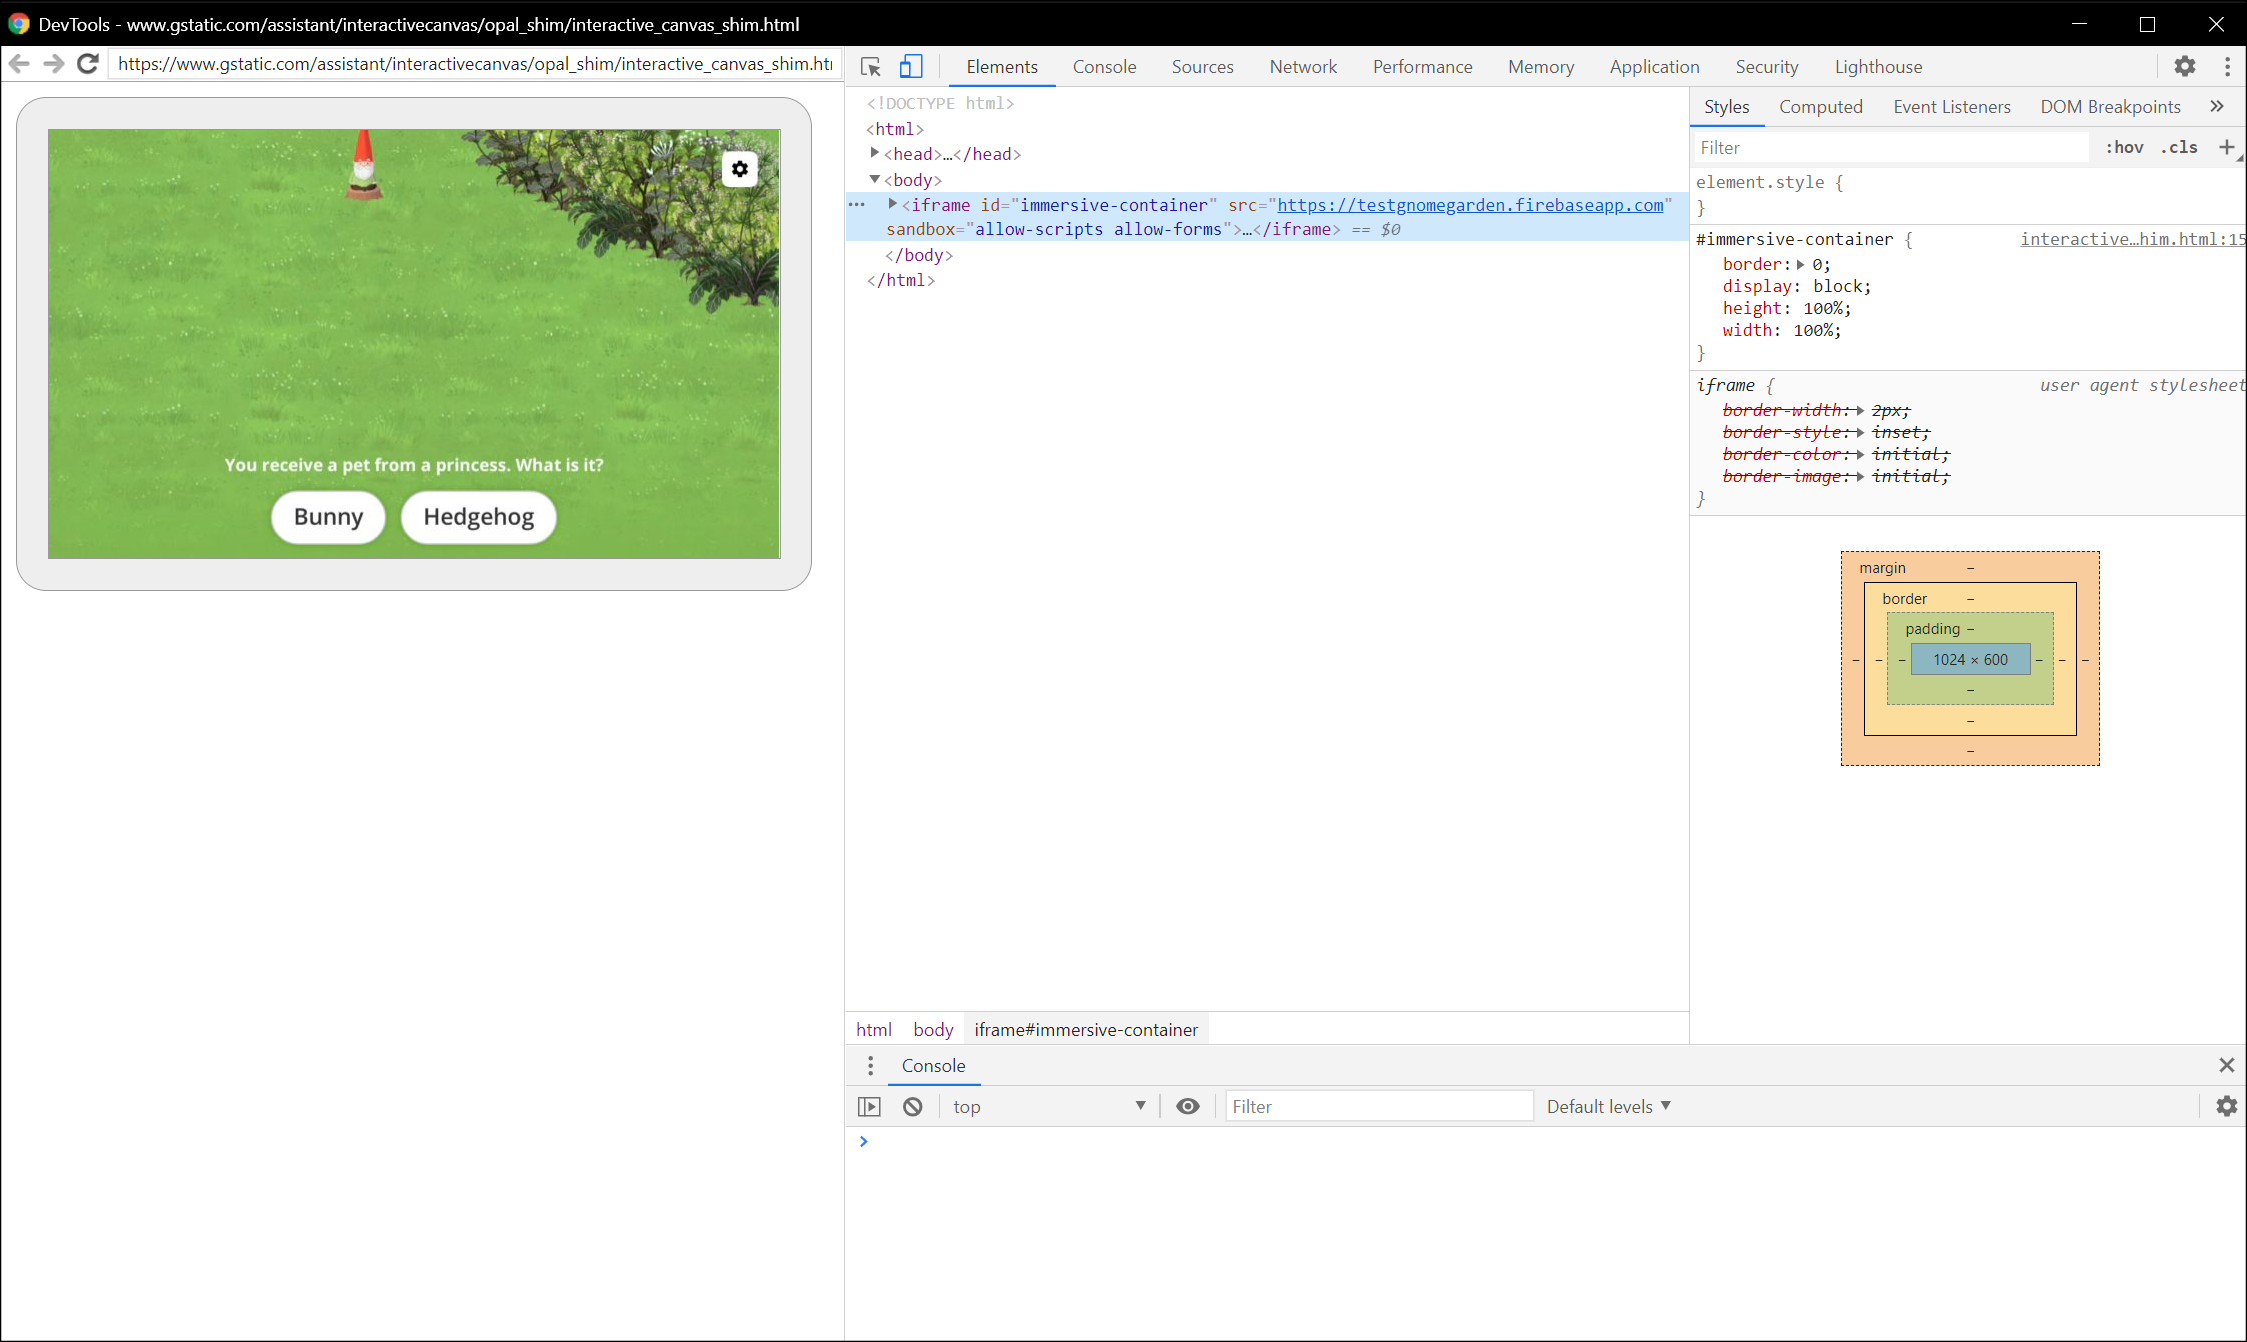
Xin lưu ý rằng ứng dụng web Canvas của bạn được tải trong một iframe.
Mẹo gỡ lỗi
Hãy ghi nhớ các mẹo bổ sung sau đây trong khi gỡ lỗi:
Làm mới trang trong Công cụ của Chrome cho nhà phát triển để tải lại vùng chứa ứng dụng phương thức thực hiện cục bộ bằng mã mới nhất từ URL phát triển của bạn.
Kiểm tra để đảm bảo rằng ứng dụng JavaScript của bạn tải mà không gặp lỗi. Để thực hiện việc này, hãy kiểm tra mục bảng điều khiển trên trang Công cụ cho nhà phát triển.
Thêm điểm ngắt thủ công vào mã bằng cách sử dụng debugger; trong mã ứng dụng web.
Nếu bạn không thấy thiết bị của mình trong chrome://inspect#devices trong một khoảng thời gian dài, hãy làm mới trang kiểm tra.
Vì bộ nhớ màn hình thông minh có giới hạn, nên ứng dụng web của bạn có thể gặp sự cố hoặc bị treo nếu vượt quá 200 MB. Để gỡ lỗi mọi vấn đề về bộ nhớ, hãy làm theo hướng dẫn Khắc phục vấn đề về bộ nhớ.
Đối với mọi lỗi về phương thức thực hiện, hãy xem các yêu cầu do máy chủ Actions on Google gửi đến webhook trong nhật ký webhook hoặc từ nhật ký Stackdriver.
[null,null,["Cập nhật lần gần đây nhất: 2025-07-25 UTC."],[[["\u003cp\u003eDebug your Interactive Canvas web app using Chrome DevTools on Google Home or Nest smart displays running supported software and firmware versions.\u003c/p\u003e\n"],["\u003cp\u003eSet up your environment by enabling your Action for testing, connecting devices to the same network, ensuring network connectivity, and using the same Google account.\u003c/p\u003e\n"],["\u003cp\u003eConnect to the debugger by launching Chrome Inspector, locating your device and Canvas HTML URL, and clicking "inspect" to open DevTools.\u003c/p\u003e\n"],["\u003cp\u003eUtilize debugging tips such as refreshing the DevTools page, checking for JavaScript errors, adding breakpoints, and monitoring performance and memory usage.\u003c/p\u003e\n"],["\u003cp\u003eThird-party smart display devices are not supported for debugging Canvas web apps.\u003c/p\u003e\n"]]],[],null,["# Debug your Interactive Canvas web app with Chrome DevTools\n\nYou can debug your Interactive Canvas web app using [Chrome DevTools](https://developers.google.com/web/tools/chrome-devtools). The Chrome debugger\nis supported on Google Home or Google Nest smart displays with a software\nversion of 30 or later (this update starts rolling out in October 2020)\nand a Cast firmware version of 1.50 or later. You can\ncheck the versions under `System settings / About device` on your smart display.\n| **Note:** Debugging Canvas web apps on third-party smart display devices is not supported.\n\nSet up your environment\n-----------------------\n\nBefore you can debug, do the following to set up your environment correctly:\n\n- Enable your Action for testing in the Actions console [simulator](/assistant/conversational/build/projects#test_projects_in_the_simulator).\n- Connect your machine to the same local area network as the Google Home or Google Nest device you are testing.\n- Ensure that your network doesn't block packets between devices.\n- Log in with the same Google account on the Actions console and on the Google Home or Google Nest device.\n\nOnce your environment is ready, you can launch your Action on your test\nsmart display.\n| **Note:** You cannot debug your Canvas web app until you've launched your development Action on your test smart display.\n\nConnect Canvas web app to debugger\n----------------------------------\n\nTo connect your Canvas web app to the Chrome DevTools debugger, follow these\nsteps:\n\n1. In your local development machine, install and launch the [Google Chrome browser](https://www.google.com/chrome/).\n2. In the address field of your Chrome browser, enter `chrome://inspect#devices` to launch the Chrome inspector. You should see a list of devices on the page, and the Canvas HTML URL should be listed under the name of your test Google Home or Google Nest device. Note that it might take some time for Chrome to discover all the devices on your network.\n3. Click the `inspect` link under the HTML URL to launch Chrome DevTools.\n\nChrome DevTools loads in its own window. You can click the screencast\n()\nbutton to see the web GUI rendered on the device. The following screenshot shows\nhow your web app appears in Chrome DevTools:\n\nNote that your Canvas web app is loaded in an iframe.\n\nDebugging tips\n--------------\n\nKeep the following additional tips in mind during debugging:\n\n- Refresh the page in Chrome DevTools to reload your local fulfillment app container with the latest code from your development URL.\n- Check that your JavaScript app loads without errors. To do this, check the console section of the DevTools page.\n- Add manual breakpoints to your code by using `debugger;` within your web app code.\n- If you don't see your device in the `chrome://inspect#devices` for an extended period of time, refresh the inspect page.\n- To debug any performance issues, follow the [Get Started with Analyzing Runtime Performance tutorial](https://developers.google.com/web/tools/chrome-devtools/evaluate-performance).\n- Because the smart display memory is limited, your web app might crash or hang if it goes over 200MB. To debug any memory issues, follow the [Fix Memory Problems tutorial](https://developers.google.com/web/tools/chrome-devtools/memory-problems).\n- For any fulfillment errors, look at requests sent by Actions on Google servers to the webhook from your webhook logs or from Stackdriver logs."]]