
您可以使用 Chrome 开发者工具调试 Interactive Canvas Web 应用。Google Home 或 Google Nest 智能显示屏支持 Chrome 调试程序,软件版本为 30 或更高版本(此更新从 2020 年 10 月开始发布),而 Cast 固件版本为 1.50 或更高版本。你可以在智能显示屏上的 System settings / About device 下查看版本。
设置您的环境
在调试之前,请执行以下操作以正确设置您的环境:
- 在 Actions 控制台模拟器中启用您的 Action 以进行测试。
- 将你的计算机连接到要测试的 Google Home 或 Google Nest 设备所在的局域网。
- 确保您的网络不会屏蔽设备之间的数据包。
- 在 Actions 控制台和 Google Home 或 Google Nest 设备上,使用相同的 Google 帐号登录。
环境准备就绪后,您便可以在智能测试显示屏上启动 Action。
将 Canvas Web 应用连接到调试程序
如需将 Canvas Web 应用连接到 Chrome 开发者工具调试程序,请按以下步骤操作:
- 在本地开发机器上,安装并启动 Google Chrome 浏览器。
- 在 Chrome 浏览器的地址字段中,输入
chrome://inspect#devices以启动 Chrome 检查器。您应该会在页面上看到设备列表,并且画布 HTML 网址应该会列在测试用 Google Home 或 Google Nest 设备的名称下方。请注意,Chrome 可能需要一些时间才能发现您网络中的所有设备。 - 点击 HTML 网址下的
inspect链接以启动 Chrome 开发者工具。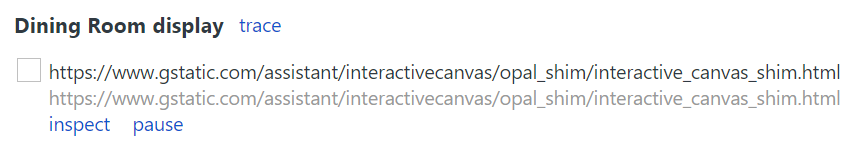
Chrome 开发者工具会在自己的窗口中加载。您可以点击抓屏 (![]() ) 按钮来查看设备上呈现的网页 GUI。以下屏幕截图展示了您的 Web 应用在 Chrome 开发者工具中的显示方式:
) 按钮来查看设备上呈现的网页 GUI。以下屏幕截图展示了您的 Web 应用在 Chrome 开发者工具中的显示方式:
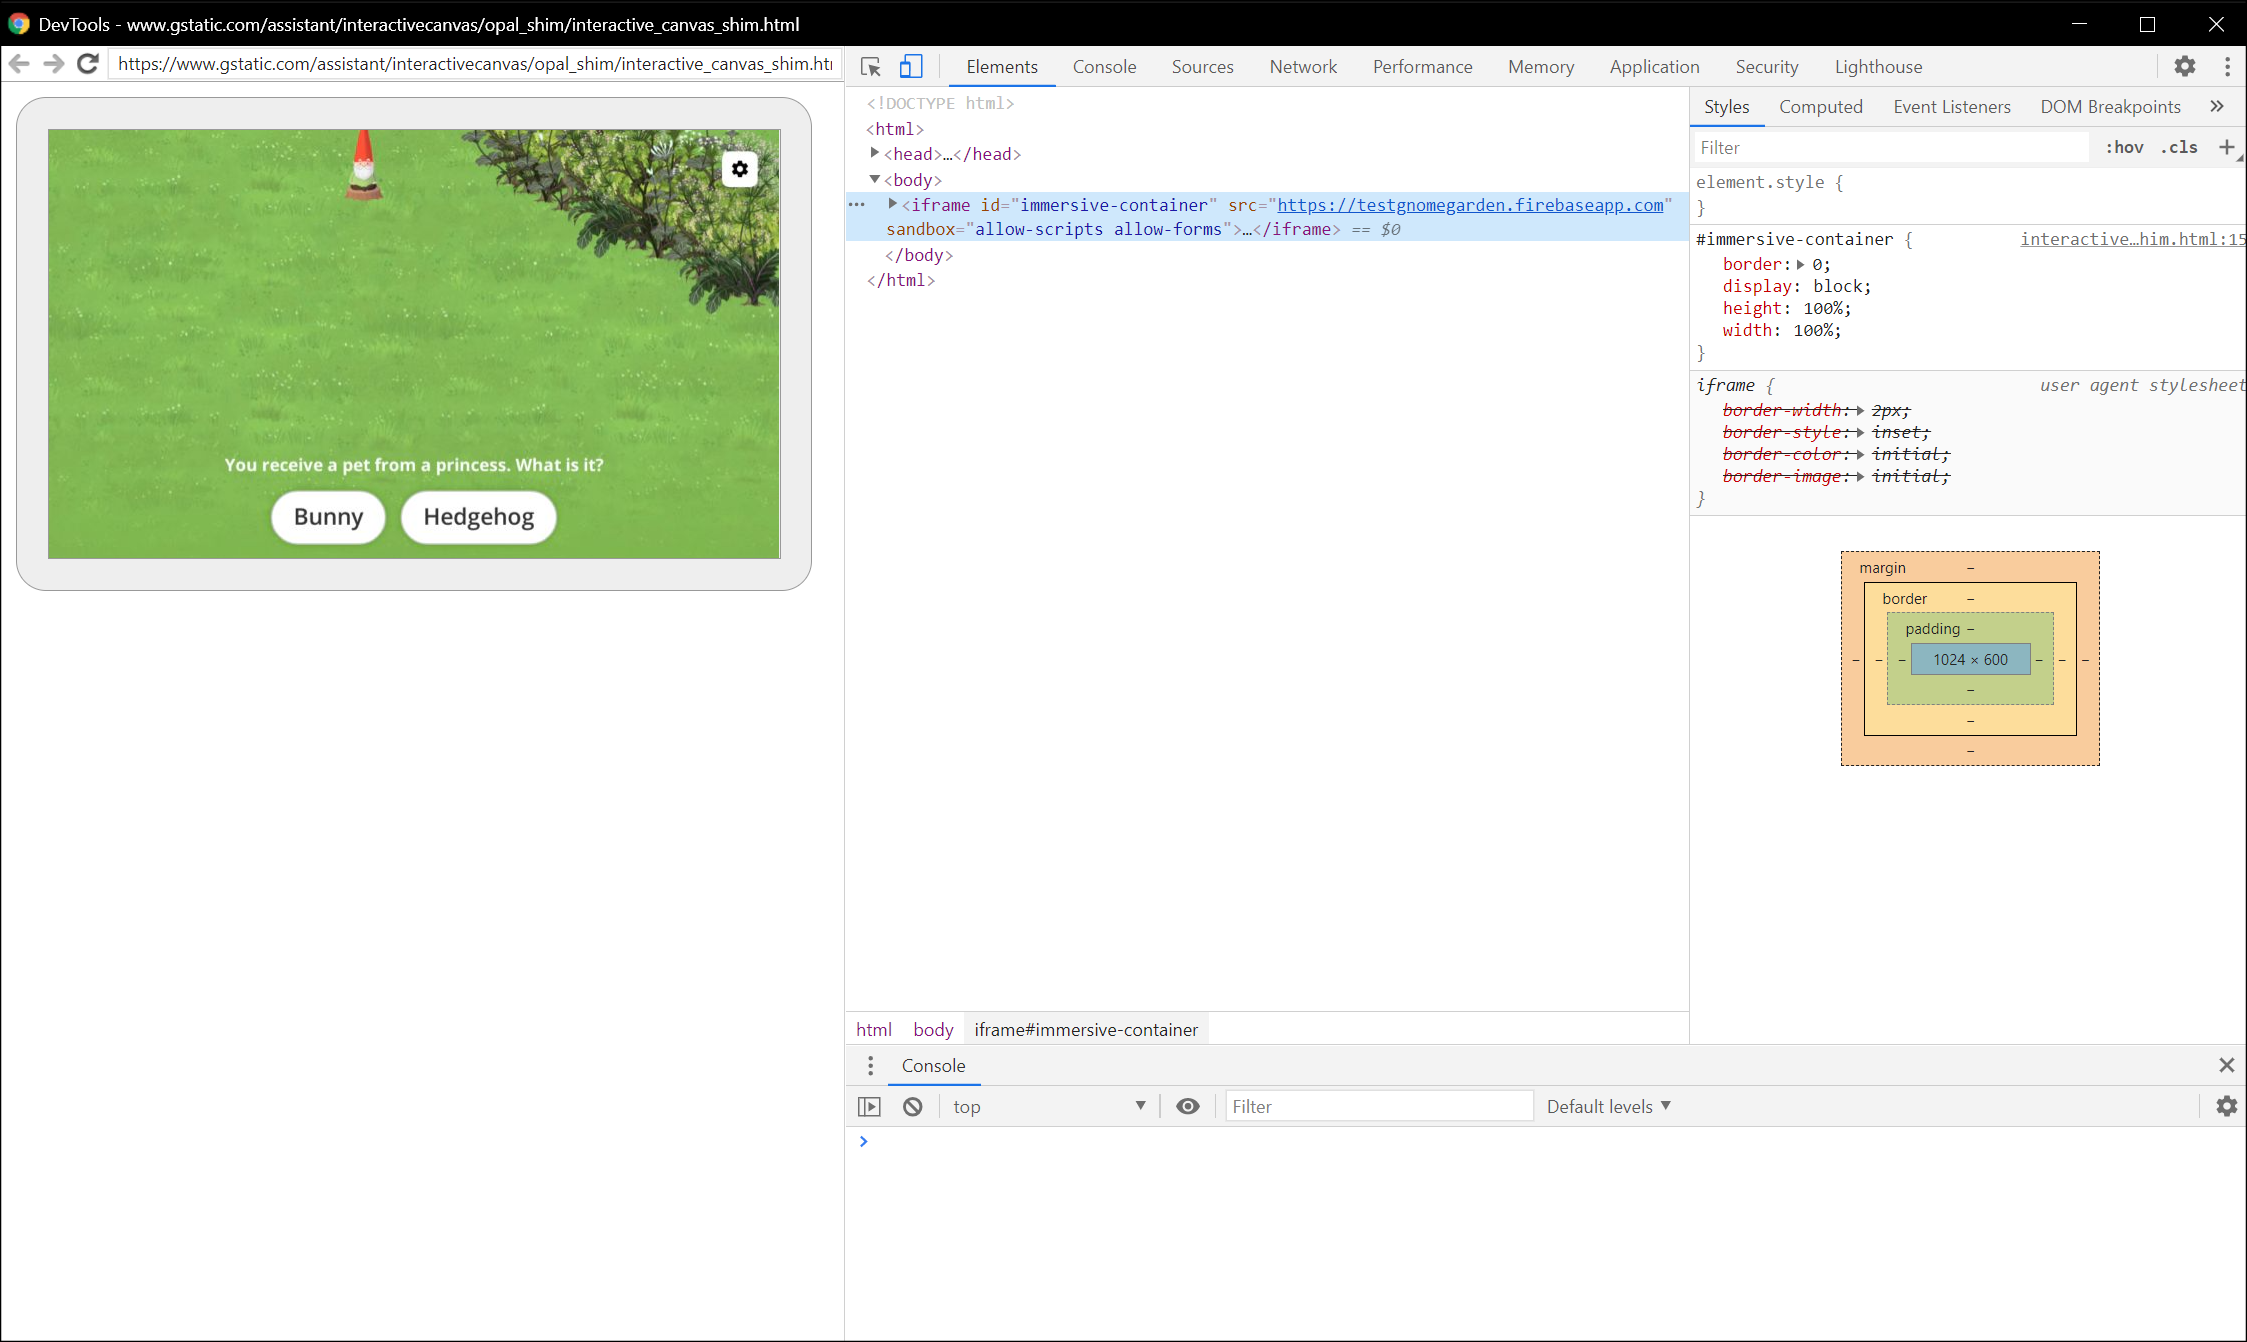
请注意,您的 Canvas Web 应用会在 iframe 中加载。
调试提示
在调试过程中,请牢记以下附加提示:
- 在 Chrome 开发者工具中刷新页面,以使用开发网址中的最新代码重新加载本地执行方式应用容器。
- 检查 JavaScript 应用是否正确加载。为此,请查看开发者工具页面的控制台部分。
- 通过在 Web 应用代码中使用
debugger;,您可以手动在代码中添加断点。 - 如果您的设备长时间未显示在
chrome://inspect#devices中,请刷新检查页面。 - 如需调试任何性能问题,请按照“分析运行时性能入门”教程进行操作。
- 由于智能显示屏的内存有限,因此如果 Web 应用超过 200 MB,它可能会崩溃或挂起。如需调试任何内存问题,请按照“修复内存问题”教程进行操作。
- 对于任何执行方式错误,请查看 Actions on Google 服务器从 webhook 日志或 Stackdriver 日志发送到 webhook 的请求。