概览
十字准线是以图表中的数据点为中心的细竖线和水平线。如果您作为图表创建者,在图表中启用十字准线,您的用户便可定位单个元素:
十字准线可以出现在焦点和/或选定范围上。适用于散点图、折线图、面积图以及组合图表的折线图和面积图。
简单示例
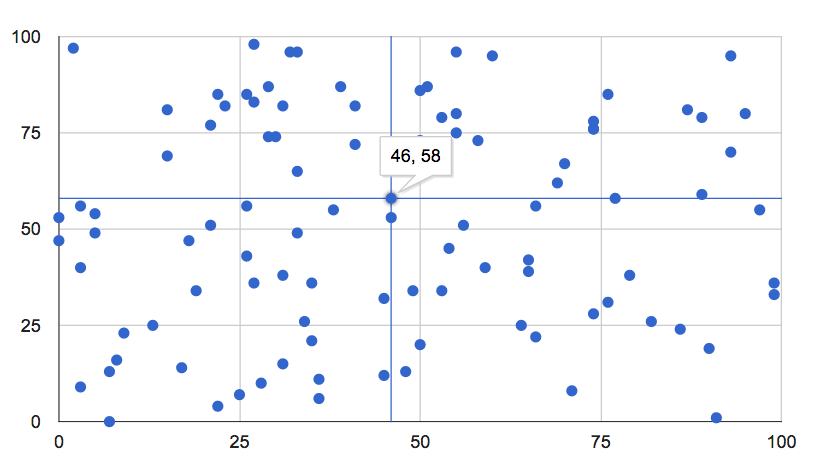
将鼠标悬停在下方的点上或选择这些点,即可查看十字准线:
下面是一个用于创建上述图表的完整网页,其中十字线的线条以粗体显示:
<html>
  <head>
    <script type="text/javascript" src="https://www.gstatic.com/charts/loader.js"></script>
    <script type="text/javascript">
      google.charts.load("current", {packages:["corechart"]});
      google.charts.setOnLoadCallback(drawChart);
      function drawChart() {
        var data = new google.visualization.DataTable();
        data.addColumn('number');
        data.addColumn('number');
        for (var i = 0; i < 100; i++)
          data.addRow([Math.floor(Math.random()*100),
                       Math.floor(Math.random()*100)]);
        var options = {
          legend: 'none',
          crosshair: { trigger: 'both' } // Display crosshairs on focus and selection.
        };
        var chart = new google.visualization.ScatterChart(document.getElementById('chart_div'));
        chart.draw(data, options);
      }
    </script>
  </head>
  <body>
    <div id="chart_div" style="width: 900px; height: 500px;"></div>
  </body>
</html>
十字准线选项
您可以使用以下十字光标选项:
crosshair: { trigger: 'both' } | 同时显示在焦点和选择区域 |
crosshair: { trigger: 'focus' } | 仅在焦点上显示 |
crosshair: { trigger: 'selection' } | 仅在选择时显示 |
crosshair: { orientation: 'both' } | 同时显示横排和竖屏发型 |
crosshair: { orientation: 'horizontal' } | 仅显示横轴发型 |
crosshair: { orientation: 'vertical' } | 只显示纵向头发 |
crosshair: { color: color_string } | 将十字光标颜色设置为 color_string,例如'red' 或 '#f00' |
crosshair: { opacity: opacity_number } | 将十字准线不透明度设置为 opacity_number,其中 0.0 表示完全透明,1.0 表示完全不透明 |
crosshair: { focused: { color: color_string } } | 将十字准线颜色设置为对焦上的 color_string |
crosshair: { focused: { opacity: opacity_number } } | 将十字准线不透明度设置为焦点的 opacity_number |
crosshair: { selected: { color: color_string } } | 在选择时将十字光标颜色设置为 color_string |
crosshair: { selected: { opacity: opacity_number } } | 选择时将十字准线不透明度设置为 opacity_number |