데이터 소스 라이브러리 소개
컬렉션을 사용해 정리하기
내 환경설정을 기준으로 콘텐츠를 저장하고 분류하세요.
Google 시각화 데이터 소스 라이브러리를 사용하면 시각화 데이터 소스를 쉽게 만들 수 있습니다. 라이브러리는 Google 시각화 API 전송 프로토콜과 쿼리 언어를 구현합니다. 라이브러리에 데이터를 사용할 수 있도록 하는 데 필요한 코드만 데이터 표 형식으로 작성합니다. 데이터 테이블은 모든 열이 단일 유형인 값의 2차원 테이블입니다. 추상 클래스와 도우미 함수를 프로비저닝하면 필요한 코드를 더 쉽게 작성할 수 있습니다.
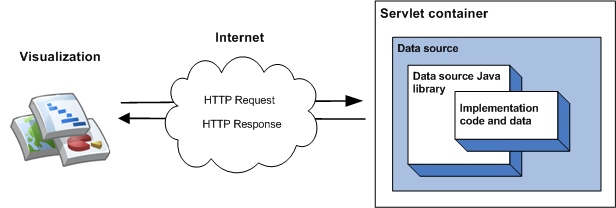
라이브러리의 가장 간단한 구현은 단일 클래스에서 상속받고, 구성원 함수를 구현하고, 데이터 세트를 서블릿 컨테이너 내에서 서블릿으로 실행하는 것입니다. 가장 간단한 구현에서는 시각화가 데이터 소스를 쿼리할 때 다음과 같은 이벤트 시퀀스가 발생합니다.
- 서블릿 컨테이너는 쿼리를 처리하고 데이터 소스 자바 라이브러리에 전달합니다.
- 라이브러리가 쿼리를 파싱합니다.
- 개발자가 작성하는 코드인 구현 코드는 라이브러리에 데이터 테이블을 반환합니다.
- 라이브러리는 데이터 테이블에서 쿼리를 실행합니다.
- 라이브러리는 시각화에서 예상하는 응답으로 데이터 테이블을 렌더링합니다.
- 서블릿 컨테이너는 시각화에 응답을 반환합니다.
다음 다이어그램을 참조하세요.

데이터 소스 시작하기 섹션에서는 이러한 유형의 데이터 소스를 구현하는 방법을 설명합니다.
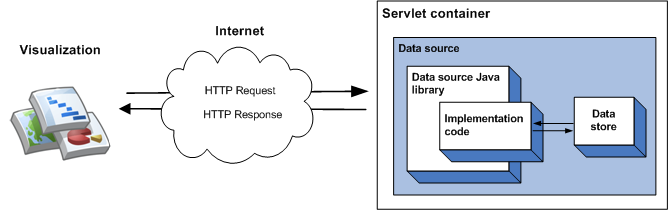
데이터 소스에서 제공하는 데이터는 구현 코드에 지정할 수 있으며, 소량의 정적 데이터에 적합합니다. 큰 데이터 세트의 경우 외부 파일 또는 데이터베이스와 같은 외부 데이터 저장소를 사용해야 할 가능성이 높습니다. 데이터 소스가 외부 데이터 저장소를 사용하는 경우 시각화에서 데이터 소스를 쿼리할 때 다음과 같은 이벤트 시퀀스가 발생합니다.
- 서블릿 컨테이너는 쿼리를 처리하고 데이터 소스 자바 라이브러리에 전달합니다.
- 라이브러리가 쿼리를 파싱합니다.
- 구현 코드(작성하는 코드)는 데이터 저장소에 저장된 데이터를 읽고 데이터 테이블을 라이브러리에 반환합니다. 데이터 세트가 많고 데이터 저장소에 쿼리 기능이 있다면 선택적으로 이러한 기능을 사용하여 데이터 소스의 효율성을 높일 수 있습니다.
- 라이브러리는 데이터 테이블에서 쿼리를 실행합니다.
- 라이브러리는 시각화에서 예상하는 응답으로 데이터 테이블을 렌더링합니다.
- 서블릿 컨테이너는 시각화에 응답을 반환합니다.
다음 다이어그램을 참조하세요.

외부 데이터 저장소 사용 섹션에서는 이 유형의 데이터 소스를 구현하는 방법을 설명합니다.
달리 명시되지 않는 한 이 페이지의 콘텐츠에는 Creative Commons Attribution 4.0 라이선스에 따라 라이선스가 부여되며, 코드 샘플에는 Apache 2.0 라이선스에 따라 라이선스가 부여됩니다. 자세한 내용은 Google Developers 사이트 정책을 참조하세요. 자바는 Oracle 및/또는 Oracle 계열사의 등록 상표입니다.
최종 업데이트: 2024-07-10(UTC)
[null,null,["최종 업데이트: 2024-07-10(UTC)"],[[["\u003cp\u003eThe Google Visualization Data Source Library simplifies the creation of visualization data sources by implementing the Google Visualization API wire protocol and query language.\u003c/p\u003e\n"],["\u003cp\u003eDevelopers primarily need to write code to make their data available as a data table, leveraging the library's abstract classes and helper functions.\u003c/p\u003e\n"],["\u003cp\u003eData sources can be implemented as servlets, handling queries from visualizations and returning data tables for rendering.\u003c/p\u003e\n"],["\u003cp\u003eFor larger datasets, the library supports using external data stores like files or databases, enabling efficient querying capabilities.\u003c/p\u003e\n"],["\u003cp\u003eThe library handles query parsing, data table execution, and rendering into the response format expected by the visualization.\u003c/p\u003e\n"]]],[],null,["# Introduction to the Data Source Library\n\n[Visit\nthe library project page!](http://code.google.com/p/google-visualization-java/)\n\nThe Google Visualization Data Source Library makes\nit easy to create a visualization data source. The library implements\nthe Google Visualization API wire\nprotocol and query language. You write only the code that is required to\nmake your data available to the library in the form of a data\ntable. A data table is a two-dimensional table of values where every\ncolumn is of a single type. Writing the code that you need is made easier\nby the provision of abstract classes and helper functions.\n\nThe simplest implementation of the library involves inheriting from\na single class, implementing a member function and running the\ndata source as a servlet within a servlet container. In the simplest\nimplementation, the following sequence of events takes place\nwhen a visualization queries the data source:\n\n1. The servlet container handles the query and passes it to the data source Java library.\n2. The library parses the query.\n3. The implementation code - the code that you write - returns a data table to the library.\n4. The library executes the query on the data table.\n5. The library renders the data table into the response expected by the visualization.\n6. The servlet container returns the response to the visualization.\n\nThis is illustrated in the following diagram:\n\nThe [Getting Started with Data Sources](/chart/interactive/docs/dev/dsl_get_started) section describes\nhow to implement this type of data source.\n\nThe data\nthat is served by a data source can be specified in your implementation\ncode, which is fine for small amounts of static data. For larger\ndata sets it is more likely you will need to use an external data store\nsuch as an external file or database. If a data source uses an external\ndata store, the following sequence of events takes place when a visualization\nqueries the data source:\n\n1. The servlet container handles the query and passes it to the data source Java library.\n2. The library parses the query.\n3. The implementation code - the code you write - reads the data held in the data store and returns a data table to the library. If the data set is large, and the data store has querying [capabilities](/chart/interactive/docs/dev/dsl_key_concepts#capabilities), you can optionally use those capabilities to increase the efficiency of your data source.\n4. The library executes the query on the data table.\n5. The library renders the data table into the response expected by the visualization.\n6. The servlet container returns the response to the visualization.\n\nThis is illustrated in the following diagram:\n\nThe [Using an External Data Store](/chart/interactive/docs/dev/dsl_csv) section describes how to implement this\ntype of data source."]]