資料來源程式庫簡介
透過集合功能整理內容
你可以依據偏好儲存及分類內容。
Google 視覺化資料來源程式庫可讓您輕鬆建立視覺化資料來源。程式庫會實作 Google 視覺化 API 傳輸通訊協定和查詢語言。您只需編寫資料形式的程式碼,即可將資料提供給程式庫。資料表是二維資料表,每個資料欄都屬於單一類型。提供抽象類別和輔助函式,讓您更輕鬆地編寫所需的程式碼。
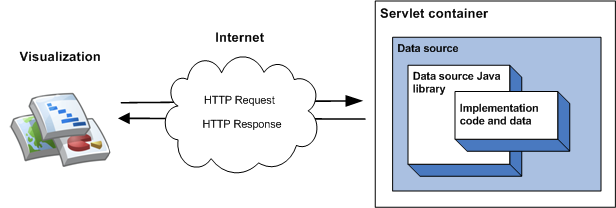
最簡單的程式庫實作方式是沿用單一類別、實作成員函式,以及將資料來源做為 Webhook 容器中的 bq 執行。在最簡單的導入方式中,視覺化查詢查詢資料來源時會依序發生以下事件:
- bq 容器會處理查詢,並將查詢傳送至資料來源 Java 程式庫。
- 程式庫會剖析查詢。
- 實作程式碼 (您編寫的程式碼) 會將資料表傳回程式庫。
- 程式庫會在資料表上執行查詢。
- 程式庫會將資料表轉譯為視覺化呈現預期的回應。
- bq 容器會傳回視覺化圖表的回應。
如下圖所示:

「開始使用資料來源」一節說明如何實作這類資料來源。
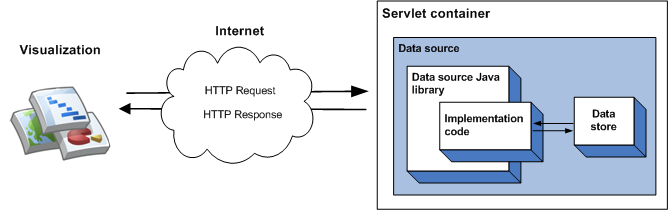
您可以在實作程式碼中指定由資料來源提供的資料,適用於少量靜態資料。資料集越大,您需要使用外部資料儲存庫 (例如外部檔案或資料庫)。如果資料來源使用外部資料儲存庫,則視覺化圖表查詢資料來源時,會發生以下事件順序:
- bq 容器會處理查詢,並將查詢傳送至資料來源 Java 程式庫。
- 程式庫會剖析查詢。
- 實作程式碼 (您編寫的程式碼) 會讀取儲存在資料儲存庫中的資料,並將資料表格傳回程式庫。如果資料集較大,且資料儲存庫有查詢功能,則可以選擇使用這些功能提高資料來源的效率。
- 程式庫會在資料表上執行查詢。
- 程式庫會將資料表轉譯為視覺化呈現預期的回應。
- bq 容器會傳回視覺化圖表的回應。
如下圖所示:

如要瞭解如何使用這類資料來源,請參閱使用外部資料儲存庫一節。
除非另有註明,否則本頁面中的內容是採用創用 CC 姓名標示 4.0 授權,程式碼範例則為阿帕契 2.0 授權。詳情請參閱《Google Developers 網站政策》。Java 是 Oracle 和/或其關聯企業的註冊商標。
上次更新時間:2024-07-10 (世界標準時間)。
[null,null,["上次更新時間:2024-07-10 (世界標準時間)。"],[[["\u003cp\u003eThe Google Visualization Data Source Library simplifies the creation of visualization data sources by implementing the Google Visualization API wire protocol and query language.\u003c/p\u003e\n"],["\u003cp\u003eDevelopers primarily need to write code to make their data available as a data table, leveraging the library's abstract classes and helper functions.\u003c/p\u003e\n"],["\u003cp\u003eData sources can be implemented as servlets, handling queries from visualizations and returning data tables for rendering.\u003c/p\u003e\n"],["\u003cp\u003eFor larger datasets, the library supports using external data stores like files or databases, enabling efficient querying capabilities.\u003c/p\u003e\n"],["\u003cp\u003eThe library handles query parsing, data table execution, and rendering into the response format expected by the visualization.\u003c/p\u003e\n"]]],[],null,["# Introduction to the Data Source Library\n\n[Visit\nthe library project page!](http://code.google.com/p/google-visualization-java/)\n\nThe Google Visualization Data Source Library makes\nit easy to create a visualization data source. The library implements\nthe Google Visualization API wire\nprotocol and query language. You write only the code that is required to\nmake your data available to the library in the form of a data\ntable. A data table is a two-dimensional table of values where every\ncolumn is of a single type. Writing the code that you need is made easier\nby the provision of abstract classes and helper functions.\n\nThe simplest implementation of the library involves inheriting from\na single class, implementing a member function and running the\ndata source as a servlet within a servlet container. In the simplest\nimplementation, the following sequence of events takes place\nwhen a visualization queries the data source:\n\n1. The servlet container handles the query and passes it to the data source Java library.\n2. The library parses the query.\n3. The implementation code - the code that you write - returns a data table to the library.\n4. The library executes the query on the data table.\n5. The library renders the data table into the response expected by the visualization.\n6. The servlet container returns the response to the visualization.\n\nThis is illustrated in the following diagram:\n\nThe [Getting Started with Data Sources](/chart/interactive/docs/dev/dsl_get_started) section describes\nhow to implement this type of data source.\n\nThe data\nthat is served by a data source can be specified in your implementation\ncode, which is fine for small amounts of static data. For larger\ndata sets it is more likely you will need to use an external data store\nsuch as an external file or database. If a data source uses an external\ndata store, the following sequence of events takes place when a visualization\nqueries the data source:\n\n1. The servlet container handles the query and passes it to the data source Java library.\n2. The library parses the query.\n3. The implementation code - the code you write - reads the data held in the data store and returns a data table to the library. If the data set is large, and the data store has querying [capabilities](/chart/interactive/docs/dev/dsl_key_concepts#capabilities), you can optionally use those capabilities to increase the efficiency of your data source.\n4. The library executes the query on the data table.\n5. The library renders the data table into the response expected by the visualization.\n6. The servlet container returns the response to the visualization.\n\nThis is illustrated in the following diagram:\n\nThe [Using an External Data Store](/chart/interactive/docs/dev/dsl_csv) section describes how to implement this\ntype of data source."]]