مقدمة في مكتبة مصادر البيانات
تنظيم صفحاتك في مجموعات
يمكنك حفظ المحتوى وتصنيفه حسب إعداداتك المفضّلة.
تُسهّل "مكتبة مصادر بيانات التمثيل البصري على Google" إنشاء مصدر بيانات التمثيل البصري. وتطبّق المكتبة بروتوكول السلك API المرئي من Google ولغة طلب البحث. وما عليك سوى كتابة الرمز المطلوب لإتاحة بياناتك للمكتبة على شكل جدول بيانات. جدول البيانات هو جدول ثنائي الأبعاد للقيم حيث يكون كل عمود من نوع واحد. أصبح كتابة الرمز الذي تحتاج إليه أسهل من خلال توفير الدروس التجريدية والوظائف المساعدة.
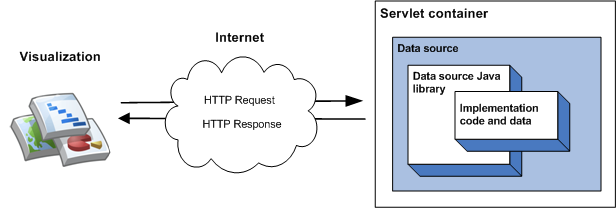
تتمثل أبسط عملية تنفيذ للمكتبة في اكتساب سمات من فئة واحدة وتنفيذ دالة عضو وتشغيل مصدر البيانات كمحرّك داخل حاوية سيرفل. في أبسط عمليات التنفيذ، يحدث التسلسل التالي للأحداث عندما يبحث التمثيل البصري عن مصدر البيانات:
- تُعالج حاوية محاولة الوصول إلى طلب البحث وتمريره إلى مكتبة مصدر بيانات Java.
- تحلّل المكتبة الطلب.
- يعرض رمز التنفيذ - الرمز الذي تكتبه - جدول بيانات إلى المكتبة.
- تنفّذ المكتبة الطلب في جدول البيانات.
- تعرض المكتبة جدول البيانات في الاستجابة المتوقعة من قِبل التمثيل البصري.
- تعرض حاوية بحثخة الاستجابة للتمثيل البصري.
وقد تم توضيح ذلك في الرسم البياني التالي:

يوضّح قسم البدء في استخدام مصادر البيانات كيفية تنفيذ هذا النوع من مصادر البيانات.
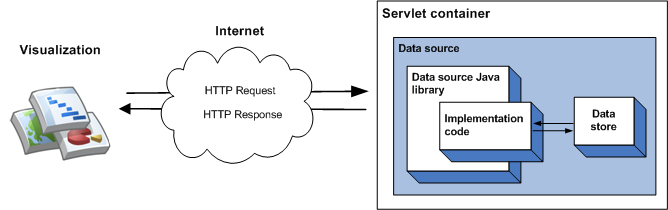
يمكن تحديد البيانات التي يتم عرضها من خلال مصدر بيانات في رمز التنفيذ، ويمكن استخدام هذه البيانات لكميات صغيرة من البيانات الثابتة. وبالنسبة إلى مجموعات البيانات الأكبر حجمًا، من المرجّح أن تحتاج إلى استخدام مخزن بيانات خارجي، مثل ملف أو قاعدة بيانات خارجية. إذا كان مصدر البيانات يستخدم مخزن بيانات خارجيًا، سيحدث التسلسل التالي للأحداث عند طلب التمثيل البصري لمصدر البيانات:
- تتعامل حاوية بحث الخدمة مع طلب البحث وتنقله إلى مكتبة Java لمصدر البيانات.
- تحلّل المكتبة الطلب.
- يشير رمز التنفيذ - الرمز الذي تكتبه - إلى البيانات المحفوظة في مخزن البيانات وعرض جدول بيانات في المكتبة. إذا كانت مجموعة البيانات كبيرة
وكان مخزن البيانات يحتوي على طلبات بحث لإمكانات، يمكنك اختياريًا استخدام هذه الإمكانات لزيادة
كفاءة مصدر بياناتك.
- تنفّذ المكتبة الطلب في جدول البيانات.
- تعرض المكتبة جدول البيانات في الاستجابة المتوقعة من قِبل التمثيل البصري.
- تعرض حاوية بحث Service
الاستجابة إلى التمثيل البصري.
وقد تم توضيح ذلك في الرسم البياني التالي:

يوضّح قسم استخدام مخزن بيانات خارجي كيفية تنفيذ هذا النوع من مصادر البيانات.
إنّ محتوى هذه الصفحة مرخّص بموجب ترخيص Creative Commons Attribution 4.0 ما لم يُنصّ على خلاف ذلك، ونماذج الرموز مرخّصة بموجب ترخيص Apache 2.0. للاطّلاع على التفاصيل، يُرجى مراجعة سياسات موقع Google Developers. إنّ Java هي علامة تجارية مسجَّلة لشركة Oracle و/أو شركائها التابعين.
تاريخ التعديل الأخير: 2024-07-10 (حسب التوقيت العالمي المتفَّق عليه)
[null,null,["تاريخ التعديل الأخير: 2024-07-10 (حسب التوقيت العالمي المتفَّق عليه)"],[[["\u003cp\u003eThe Google Visualization Data Source Library simplifies the creation of visualization data sources by implementing the Google Visualization API wire protocol and query language.\u003c/p\u003e\n"],["\u003cp\u003eDevelopers primarily need to write code to make their data available as a data table, leveraging the library's abstract classes and helper functions.\u003c/p\u003e\n"],["\u003cp\u003eData sources can be implemented as servlets, handling queries from visualizations and returning data tables for rendering.\u003c/p\u003e\n"],["\u003cp\u003eFor larger datasets, the library supports using external data stores like files or databases, enabling efficient querying capabilities.\u003c/p\u003e\n"],["\u003cp\u003eThe library handles query parsing, data table execution, and rendering into the response format expected by the visualization.\u003c/p\u003e\n"]]],[],null,["# Introduction to the Data Source Library\n\n[Visit\nthe library project page!](http://code.google.com/p/google-visualization-java/)\n\nThe Google Visualization Data Source Library makes\nit easy to create a visualization data source. The library implements\nthe Google Visualization API wire\nprotocol and query language. You write only the code that is required to\nmake your data available to the library in the form of a data\ntable. A data table is a two-dimensional table of values where every\ncolumn is of a single type. Writing the code that you need is made easier\nby the provision of abstract classes and helper functions.\n\nThe simplest implementation of the library involves inheriting from\na single class, implementing a member function and running the\ndata source as a servlet within a servlet container. In the simplest\nimplementation, the following sequence of events takes place\nwhen a visualization queries the data source:\n\n1. The servlet container handles the query and passes it to the data source Java library.\n2. The library parses the query.\n3. The implementation code - the code that you write - returns a data table to the library.\n4. The library executes the query on the data table.\n5. The library renders the data table into the response expected by the visualization.\n6. The servlet container returns the response to the visualization.\n\nThis is illustrated in the following diagram:\n\nThe [Getting Started with Data Sources](/chart/interactive/docs/dev/dsl_get_started) section describes\nhow to implement this type of data source.\n\nThe data\nthat is served by a data source can be specified in your implementation\ncode, which is fine for small amounts of static data. For larger\ndata sets it is more likely you will need to use an external data store\nsuch as an external file or database. If a data source uses an external\ndata store, the following sequence of events takes place when a visualization\nqueries the data source:\n\n1. The servlet container handles the query and passes it to the data source Java library.\n2. The library parses the query.\n3. The implementation code - the code you write - reads the data held in the data store and returns a data table to the library. If the data set is large, and the data store has querying [capabilities](/chart/interactive/docs/dev/dsl_key_concepts#capabilities), you can optionally use those capabilities to increase the efficiency of your data source.\n4. The library executes the query on the data table.\n5. The library renders the data table into the response expected by the visualization.\n6. The servlet container returns the response to the visualization.\n\nThis is illustrated in the following diagram:\n\nThe [Using an External Data Store](/chart/interactive/docs/dev/dsl_csv) section describes how to implement this\ntype of data source."]]