מבוא לספריית מקורות הנתונים
קל לארגן דפים בעזרת אוספים
אפשר לשמור ולסווג תוכן על סמך ההעדפות שלך.
הספרייה של מקור הנתונים החזותית ב-Google מאפשרת ליצור בקלות מקור נתונים חזותי. הספרייה מיישמת את פרוטוקול הקידוד של ממשק ה-API של Google
ושפת השאילתות. אתם כותבים רק את הקוד הנדרש כדי להפוך את הנתונים
לזמינים לספרייה בצורת טבלת נתונים. טבלת נתונים היא טבלה דו-ממדית של ערכים, שבה כל עמודה היא מסוג יחיד. קל יותר לכתוב את הקוד שנחוץ לכם
על ידי הקצאת מחלקות מופשטות ופונקציות מסייעות.
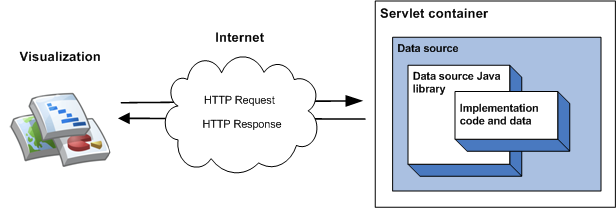
היישום הפשוט של הספרייה כולל ירושה
מכיתה אחת, יישום פונקציית חבר והפעלה של מקור הנתונים כשרת מודעות במאגר תגים. בהטמעה הפשוטה ביותר, רצף האירועים הבא מתרחש כשהדמיה של מקור נתונים מופעלת:
- מאגר שרת האינטרנט מטפל בשאילתה ומעביר אותה לספריית מקור הנתונים של Java.
- הספרייה מנתחת את השאילתה.
- קוד ההטמעה – הקוד שאתם כותבים – מחזיר לספריית הנתונים את טבלת הנתונים.
- הספרייה מבצעת את השאילתה בטבלת הנתונים.
- הספרייה מעבדת את טבלת הנתונים בתגובה הצפויה באמצעות התצוגה החזותית.
- הקונטיינר של השרת שולח את התגובה לתצוגה החזותית.
ניתן לראות זאת בתרשים הבא:

בקטע תחילת העבודה עם מקורות נתונים מוסבר איך להטמיע את הסוג הזה של מקור נתונים.
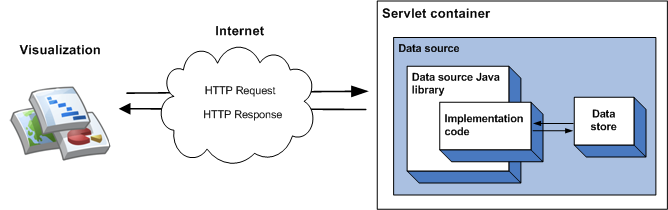
אפשר לציין בקוד הנתונים את ההטמעה של מקור הנתונים, וזה בסדר אם מדובר בכמויות קטנות של נתונים סטטיים. לגבי קבוצות נתונים גדולות יותר, סביר להניח שתצטרכו להשתמש במאגר נתונים חיצוני, כמו קובץ חיצוני או מסד נתונים. אם מקור נתונים משתמש במאגר נתונים חיצוני, רצף האירועים הבא מתרחש כשתצוגה חזותית של שאילתה שמפעילה את מקור הנתונים:
- מאגר תגים של הגשה יטפל בשאילתה ויעביר אותה לספריית הנתונים של Java.
- הספרייה מנתחת את השאילתה.
- קוד ההטמעה (הקוד שאתם כותבים) קורא את הנתונים שמאוחסנים במאגר הנתונים ומחזיר לספרייה טבלת נתונים. אם קבוצת הנתונים גדולה, ולחנות הנתונים יש יכולות שאילתה, תוכלו להשתמש ביכולות האלה כדי לשפר את היעילות של מקור הנתונים.
- הספרייה מבצעת את השאילתה בטבלת הנתונים.
- הספרייה מעבדת את טבלת הנתונים בתגובה הצפויה באמצעות התצוגה החזותית.
- הקונטיינר של השרת מציג את התגובה לתצוגה החזותית.
ניתן לראות זאת בתרשים הבא:

בקטע שימוש במאגר נתונים חיצוני מוסבר איך להטמיע את הסוג הזה של מקור נתונים.
אלא אם צוין אחרת, התוכן של דף זה הוא ברישיון Creative Commons Attribution 4.0 ודוגמאות הקוד הן ברישיון Apache 2.0. לפרטים, ניתן לעיין במדיניות האתר Google Developers. Java הוא סימן מסחרי רשום של חברת Oracle ו/או של השותפים העצמאיים שלה.
עדכון אחרון: 2024-07-10 (שעון UTC).
[null,null,["עדכון אחרון: 2024-07-10 (שעון UTC)."],[[["\u003cp\u003eThe Google Visualization Data Source Library simplifies the creation of visualization data sources by implementing the Google Visualization API wire protocol and query language.\u003c/p\u003e\n"],["\u003cp\u003eDevelopers primarily need to write code to make their data available as a data table, leveraging the library's abstract classes and helper functions.\u003c/p\u003e\n"],["\u003cp\u003eData sources can be implemented as servlets, handling queries from visualizations and returning data tables for rendering.\u003c/p\u003e\n"],["\u003cp\u003eFor larger datasets, the library supports using external data stores like files or databases, enabling efficient querying capabilities.\u003c/p\u003e\n"],["\u003cp\u003eThe library handles query parsing, data table execution, and rendering into the response format expected by the visualization.\u003c/p\u003e\n"]]],[],null,["# Introduction to the Data Source Library\n\n[Visit\nthe library project page!](http://code.google.com/p/google-visualization-java/)\n\nThe Google Visualization Data Source Library makes\nit easy to create a visualization data source. The library implements\nthe Google Visualization API wire\nprotocol and query language. You write only the code that is required to\nmake your data available to the library in the form of a data\ntable. A data table is a two-dimensional table of values where every\ncolumn is of a single type. Writing the code that you need is made easier\nby the provision of abstract classes and helper functions.\n\nThe simplest implementation of the library involves inheriting from\na single class, implementing a member function and running the\ndata source as a servlet within a servlet container. In the simplest\nimplementation, the following sequence of events takes place\nwhen a visualization queries the data source:\n\n1. The servlet container handles the query and passes it to the data source Java library.\n2. The library parses the query.\n3. The implementation code - the code that you write - returns a data table to the library.\n4. The library executes the query on the data table.\n5. The library renders the data table into the response expected by the visualization.\n6. The servlet container returns the response to the visualization.\n\nThis is illustrated in the following diagram:\n\nThe [Getting Started with Data Sources](/chart/interactive/docs/dev/dsl_get_started) section describes\nhow to implement this type of data source.\n\nThe data\nthat is served by a data source can be specified in your implementation\ncode, which is fine for small amounts of static data. For larger\ndata sets it is more likely you will need to use an external data store\nsuch as an external file or database. If a data source uses an external\ndata store, the following sequence of events takes place when a visualization\nqueries the data source:\n\n1. The servlet container handles the query and passes it to the data source Java library.\n2. The library parses the query.\n3. The implementation code - the code you write - reads the data held in the data store and returns a data table to the library. If the data set is large, and the data store has querying [capabilities](/chart/interactive/docs/dev/dsl_key_concepts#capabilities), you can optionally use those capabilities to increase the efficiency of your data source.\n4. The library executes the query on the data table.\n5. The library renders the data table into the response expected by the visualization.\n6. The servlet container returns the response to the visualization.\n\nThis is illustrated in the following diagram:\n\nThe [Using an External Data Store](/chart/interactive/docs/dev/dsl_csv) section describes how to implement this\ntype of data source."]]