数据源库简介
使用集合让一切井井有条
根据您的偏好保存内容并对其进行分类。
借助 Google 可视化数据源库,您可以轻松创建可视化数据源。该库实现了 Google 可视化 API 传输协议和查询语言。您只需以数据表的形式编写将数据提供给库所需的代码。数据表是二维值表,其中每一列都是单一类型。通过提供抽象类和辅助函数,您可以更轻松地编写所需的代码。
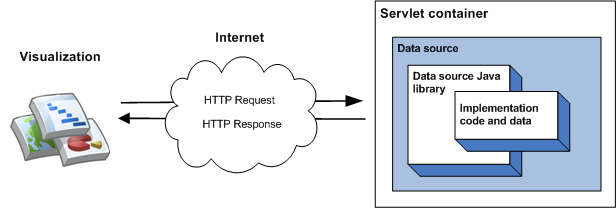
该库最简单的实现方式包括从单个类继承、实现成员函数,以及将数据源作为 servlet 容器中的 servlet 运行。在最简单的实现中,当可视化查询数据源时,会发生以下事件序列:
- servlet 容器会处理查询并将其传递给数据源 Java 库。
- 该库会解析查询。
- 实现代码(您编写的代码)会将数据表返回到库。
- 该库会对数据表执行查询。
- 该库会将数据表呈现到可视化图表预期的响应中。
- 该 servlet 容器返回对可视化图表的响应。
下图对此进行了说明:

数据源使用入门部分介绍了如何实现这种类型的数据源。
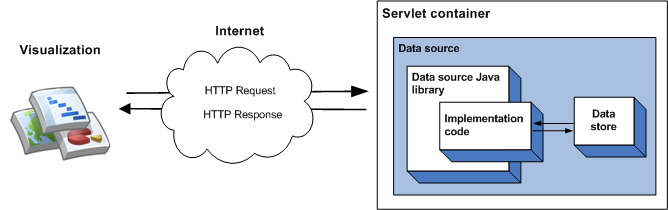
您可以在实现代码中指定数据源提供的数据,这适用于少量静态数据。对于较大的数据集,您更可能需要使用外部数据存储,如外部文件或数据库。如果数据源使用外部数据存储区,则当可视化查询数据源时,会发生以下事件序列:
- servlet 容器会处理查询并将其传递给数据源 Java 库。
- 该库会解析查询。
- 实现代码(您编写的代码)会读取保存在数据存储区中的数据,并将数据表返回到库。如果数据集很大,并且数据存储区具有查询功能,则可以选择使用这些功能提高数据源的效率。
- 该库会对数据表执行查询。
- 该库会将数据表呈现到可视化图表预期的响应中。
- 该 servlet 容器返回对可视化图表的响应。
下图对此进行了说明:

使用外部数据存储区部分介绍了如何实现这种类型的数据源。
如未另行说明,那么本页面中的内容已根据知识共享署名 4.0 许可获得了许可,并且代码示例已根据 Apache 2.0 许可获得了许可。有关详情,请参阅 Google 开发者网站政策。Java 是 Oracle 和/或其关联公司的注册商标。
最后更新时间 (UTC):2024-07-10。
[null,null,["最后更新时间 (UTC):2024-07-10。"],[[["\u003cp\u003eThe Google Visualization Data Source Library simplifies the creation of visualization data sources by implementing the Google Visualization API wire protocol and query language.\u003c/p\u003e\n"],["\u003cp\u003eDevelopers primarily need to write code to make their data available as a data table, leveraging the library's abstract classes and helper functions.\u003c/p\u003e\n"],["\u003cp\u003eData sources can be implemented as servlets, handling queries from visualizations and returning data tables for rendering.\u003c/p\u003e\n"],["\u003cp\u003eFor larger datasets, the library supports using external data stores like files or databases, enabling efficient querying capabilities.\u003c/p\u003e\n"],["\u003cp\u003eThe library handles query parsing, data table execution, and rendering into the response format expected by the visualization.\u003c/p\u003e\n"]]],[],null,["# Introduction to the Data Source Library\n\n[Visit\nthe library project page!](http://code.google.com/p/google-visualization-java/)\n\nThe Google Visualization Data Source Library makes\nit easy to create a visualization data source. The library implements\nthe Google Visualization API wire\nprotocol and query language. You write only the code that is required to\nmake your data available to the library in the form of a data\ntable. A data table is a two-dimensional table of values where every\ncolumn is of a single type. Writing the code that you need is made easier\nby the provision of abstract classes and helper functions.\n\nThe simplest implementation of the library involves inheriting from\na single class, implementing a member function and running the\ndata source as a servlet within a servlet container. In the simplest\nimplementation, the following sequence of events takes place\nwhen a visualization queries the data source:\n\n1. The servlet container handles the query and passes it to the data source Java library.\n2. The library parses the query.\n3. The implementation code - the code that you write - returns a data table to the library.\n4. The library executes the query on the data table.\n5. The library renders the data table into the response expected by the visualization.\n6. The servlet container returns the response to the visualization.\n\nThis is illustrated in the following diagram:\n\nThe [Getting Started with Data Sources](/chart/interactive/docs/dev/dsl_get_started) section describes\nhow to implement this type of data source.\n\nThe data\nthat is served by a data source can be specified in your implementation\ncode, which is fine for small amounts of static data. For larger\ndata sets it is more likely you will need to use an external data store\nsuch as an external file or database. If a data source uses an external\ndata store, the following sequence of events takes place when a visualization\nqueries the data source:\n\n1. The servlet container handles the query and passes it to the data source Java library.\n2. The library parses the query.\n3. The implementation code - the code you write - reads the data held in the data store and returns a data table to the library. If the data set is large, and the data store has querying [capabilities](/chart/interactive/docs/dev/dsl_key_concepts#capabilities), you can optionally use those capabilities to increase the efficiency of your data source.\n4. The library executes the query on the data table.\n5. The library renders the data table into the response expected by the visualization.\n6. The servlet container returns the response to the visualization.\n\nThis is illustrated in the following diagram:\n\nThe [Using an External Data Store](/chart/interactive/docs/dev/dsl_csv) section describes how to implement this\ntype of data source."]]