การใช้ Google Charts
จัดทุกอย่างให้เป็นระเบียบอยู่เสมอด้วยคอลเล็กชัน
บันทึกและจัดหมวดหมู่เนื้อหาตามค่ากำหนดของคุณ
Google Charts เป็นวิธีการแสดงภาพข้อมูลบนเว็บไซต์ที่สมบูรณ์แบบ
แผนภูมิแผนภูมิมีแผนภูมิประเภทที่พร้อมใช้งานมากมาย ตั้งแต่แผนภูมิเส้นแบบธรรมดาไปจนถึงแผนผังต้นไม้แบบลําดับชั้นที่ซับซ้อน
วิธีที่ใช้กันโดยทั่วไปสําหรับ Google Charts คือ JavaScript แบบง่ายที่ฝังอยู่ในหน้าเว็บ คุณโหลดไลบรารีของ Google Chart บางรายการ แสดงรายการข้อมูลที่ต้องการสร้างแผนภูมิ เลือกตัวเลือกเพื่อปรับแต่งแผนภูมิ และสุดท้าย สร้างออบเจ็กต์แผนภูมิด้วยรหัสที่คุณเลือก
จากนั้นในหน้าเว็บ ให้สร้าง <div> โดยใช้ id นั้นเพื่อแสดงแผนภูมิของ Google
นี่คือทั้งหมดที่คุณต้องการเริ่มต้นใช้งาน
แผนภูมิจะแสดงเป็นคลาส JavaScript และ Google Charts มีแผนภูมิหลายประเภทให้คุณใช้
ลักษณะที่ปรากฏเริ่มต้นมักจะเป็นสิ่งที่คุณต้องการ และคุณสามารถปรับแต่งแผนภูมิได้เสมอเพื่อให้เหมาะกับรูปลักษณ์ของเว็บไซต์ แผนภูมิเป็นเนื้อหาที่มีการโต้ตอบแบบอินเทอร์แอกทีฟและเปิดเผยสูง ซึ่งช่วยให้คุณเชื่อมต่อเพื่อสร้างแดชบอร์ดหรือประสบการณ์อื่นๆ ที่ผสานรวมกับหน้าเว็บที่ซับซ้อนได้
แผนภูมิจะแสดงผลโดยใช้เทคโนโลยี HTML5/SVG เพื่อให้ความเข้ากันได้กับหลายเบราว์เซอร์ (รวมถึง VML สําหรับ IE เวอร์ชันเก่า) และความสามารถในการถ่ายโอนระหว่างแพลตฟอร์มไปยัง iPhone, iPad และ Android ผู้ใช้จะไม่ต้องยุ่งยากกับปลั๊กอินหรือซอฟต์แวร์ใดๆ
หากมีเว็บเบราว์เซอร์ ก็จะเห็นแผนภูมิของคุณ
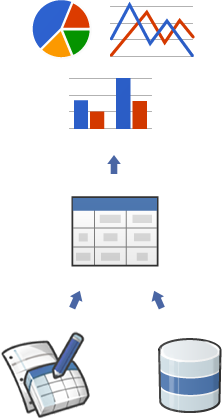
ประเภทแผนภูมิทั้งหมดจะมีข้อมูลโดยใช้คลาส DataTable ซึ่งจะช่วยให้คุณสลับระหว่างแผนภูมิประเภทต่างๆ ได้ง่ายในระหว่างการทดสอบเพื่อค้นหาลักษณะที่เหมาะสม
DataTable มีวิธีการจัดเรียง แก้ไข และกรองข้อมูล และสามารถป้อนข้อมูลได้โดยตรงจากหน้าเว็บ ฐานข้อมูล หรือผู้ให้บริการข้อมูลใดๆ ที่รองรับโปรโตคอลแหล่งข้อมูลเครื่องมือแผนภูมิ
(โปรโตคอลดังกล่าวใช้ภาษาสืบค้นแบบ SQL และมีการใช้งานโดย Google สเปรดชีต, Google ตารางฟิวชันและผู้ให้บริการข้อมูลบุคคลที่สาม เช่น SalesForce
นอกจากนี้คุณยังใช้โปรโตคอลในเว็บไซต์ของคุณเองและกลายเป็นผู้ให้บริการข้อมูลสําหรับบริการอื่นๆ ได้ด้วย)
พร้อมที่จะสร้างแผนภูมิแรกหรือยัง ไปที่คู่มือเริ่มใช้งานฉบับย่อ
เครื่องมือของเราเปลี่ยนแปลงอย่างต่อเนื่องเพื่อให้ตรงตามความต้องการของคุณมากยิ่งขึ้น เราอาศัยความคิดเห็นของคุณในการช่วยเราจัดลําดับความสําคัญของฟีเจอร์ที่จะใส่
เข้าร่วมกลุ่มสนทนา
เนื้อหาของหน้าเว็บนี้ได้รับอนุญาตภายใต้ใบอนุญาตที่ต้องระบุที่มาของครีเอทีฟคอมมอนส์ 4.0 และตัวอย่างโค้ดได้รับอนุญาตภายใต้ใบอนุญาต Apache 2.0 เว้นแต่จะระบุไว้เป็นอย่างอื่น โปรดดูรายละเอียดที่นโยบายเว็บไซต์ Google Developers Java เป็นเครื่องหมายการค้าจดทะเบียนของ Oracle และ/หรือบริษัทในเครือ
อัปเดตล่าสุด 2024-07-10 UTC
[null,null,["อัปเดตล่าสุด 2024-07-10 UTC"],[[["\u003cp\u003eGoogle Charts offers a wide variety of interactive and customizable chart types to visualize data on your website.\u003c/p\u003e\n"],["\u003cp\u003eEmbedding charts is straightforward using simple JavaScript that loads libraries, specifies data, customizes options, and creates a chart object within a div element.\u003c/p\u003e\n"],["\u003cp\u003eCharts are highly interactive, supporting events, dashboards, and integration with web pages for enhanced user experiences.\u003c/p\u003e\n"],["\u003cp\u003eGoogle Charts uses HTML5/SVG technology for cross-browser and cross-platform compatibility, ensuring accessibility for all users.\u003c/p\u003e\n"],["\u003cp\u003eData population is handled by the DataTable class, enabling easy switching between chart types and providing methods for data manipulation and sourcing.\u003c/p\u003e\n"]]],[],null,["# Using Google Charts\n\nGoogle Charts provides a perfect way to visualize data on your website.\nFrom simple line charts to complex hierarchical tree maps, the\n[chart gallery](/chart/interactive/docs/gallery)\nprovides a large number of ready-to-use chart types.\n\nThe most common way to use Google Charts is with simple JavaScript\nthat you embed in your web page. You load some Google Chart libraries,\nlist the data to be charted, select options to customize your chart,\nand finally create a chart object with an id that you choose.\nThen, later in the web page, you create a \\\u003cdiv\\\u003e\nwith that id to display the Google Chart.\n\nThat's all you need to [get started](/chart/interactive/docs/quick_start).\n\nCharts are exposed as JavaScript classes, and Google Charts provides\n[many chart types](/chart/interactive/docs/gallery) for you to use.\nThe default appearance will usually be all you need, and you can always\n[customize a chart](/chart/interactive/docs/customizing_charts)\nto fit the look and feel of your website. Charts are highly interactive and expose\n[events](/chart/interactive/docs/events) that let you connect them to create complex\n[dashboards](/chart/interactive/docs/gallery/controls) or other experiences\n[integrated with your\nwebpage](/chart/interactive/docs/examples#full_html_page_example).\nCharts are rendered using HTML5/SVG technology to provide cross-browser compatibility\n(including VML for older IE versions) and cross platform portability to iPhones,\niPads, and Android. Your users will never have to mess with plugins or any software.\nIf they have a web browser, they can see your charts.\n\nAll chart types are populated with data using the\n[DataTable](/chart/interactive/docs/reference#DataTable) class,\nmaking it easy to switch between chart types as you experiment to find the ideal appearance.\nThe DataTable provides methods for sorting, modifying, and filtering data, and can be\npopulated directly from your web page, a database, or any data provider supporting the\n[Chart Tools Datasource](/chart/interactive/docs/queries) protocol.\n(That protocol includes a SQL-like query language and is implemented by Google Spreadsheets,\nGoogle Fusion Tables and third party data providers such as SalesForce.\nYou can even implement the protocol on your own website and become a data provider\nfor other services.)\n\n**Ready to create your first chart? Visit the\n[quickstart](/chart/interactive/docs/quick_start).**\n\nOur tools are constantly evolving to better address your needs;\nwe depend on your feedback to help us prioritize which features to include.\nJoin our [discussion group](http://groups.google.com/group/google-visualization-api)."]]