Using Google Charts
Stay organized with collections
Save and categorize content based on your preferences.
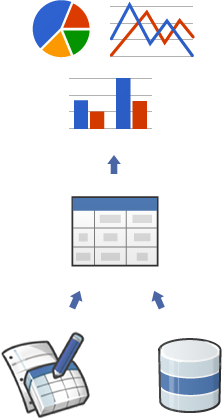
Google Charts provides a perfect way to visualize data on your website.
From simple line charts to complex hierarchical tree maps, the
chart gallery
provides a large number of ready-to-use chart types.
The most common way to use Google Charts is with simple JavaScript
that you embed in your web page. You load some Google Chart libraries,
list the data to be charted, select options to customize your chart,
and finally create a chart object with an id that you choose.
Then, later in the web page, you create a <div>
with that id to display the Google Chart.
That's all you need to get started.
Charts are exposed as JavaScript classes, and Google Charts provides
many chart types for you to use.
The default appearance will usually be all you need, and you can always
customize a chart
to fit the look and feel of your website. Charts are highly interactive and expose
events that let you connect them to create complex
dashboards or other experiences
integrated with your
webpage.
Charts are rendered using HTML5/SVG technology to provide cross-browser compatibility
(including VML for older IE versions) and cross platform portability to iPhones,
iPads, and Android. Your users will never have to mess with plugins or any software.
If they have a web browser, they can see your charts.
All chart types are populated with data using the
DataTable class,
making it easy to switch between chart types as you experiment to find the ideal appearance.
The DataTable provides methods for sorting, modifying, and filtering data, and can be
populated directly from your web page, a database, or any data provider supporting the
Chart Tools Datasource protocol.
(That protocol includes a SQL-like query language and is implemented by Google Spreadsheets,
Google Fusion Tables and third party data providers such as SalesForce.
You can even implement the protocol on your own website and become a data provider
for other services.)
Ready to create your first chart? Visit the
quickstart.
Our tools are constantly evolving to better address your needs;
we depend on your feedback to help us prioritize which features to include.
Join our
discussion group.
Except as otherwise noted, the content of this page is licensed under the Creative Commons Attribution 4.0 License, and code samples are licensed under the Apache 2.0 License. For details, see the Google Developers Site Policies. Java is a registered trademark of Oracle and/or its affiliates.
Last updated 2024-07-10 UTC.
[null,null,["Last updated 2024-07-10 UTC."],[[["\u003cp\u003eGoogle Charts offers a wide variety of interactive and customizable chart types to visualize data on your website.\u003c/p\u003e\n"],["\u003cp\u003eEmbedding charts is straightforward using simple JavaScript that loads libraries, specifies data, customizes options, and creates a chart object within a div element.\u003c/p\u003e\n"],["\u003cp\u003eCharts are highly interactive, supporting events, dashboards, and integration with web pages for enhanced user experiences.\u003c/p\u003e\n"],["\u003cp\u003eGoogle Charts uses HTML5/SVG technology for cross-browser and cross-platform compatibility, ensuring accessibility for all users.\u003c/p\u003e\n"],["\u003cp\u003eData population is handled by the DataTable class, enabling easy switching between chart types and providing methods for data manipulation and sourcing.\u003c/p\u003e\n"]]],[],null,["# Using Google Charts\n\nGoogle Charts provides a perfect way to visualize data on your website.\nFrom simple line charts to complex hierarchical tree maps, the\n[chart gallery](/chart/interactive/docs/gallery)\nprovides a large number of ready-to-use chart types.\n\nThe most common way to use Google Charts is with simple JavaScript\nthat you embed in your web page. You load some Google Chart libraries,\nlist the data to be charted, select options to customize your chart,\nand finally create a chart object with an id that you choose.\nThen, later in the web page, you create a \\\u003cdiv\\\u003e\nwith that id to display the Google Chart.\n\nThat's all you need to [get started](/chart/interactive/docs/quick_start).\n\nCharts are exposed as JavaScript classes, and Google Charts provides\n[many chart types](/chart/interactive/docs/gallery) for you to use.\nThe default appearance will usually be all you need, and you can always\n[customize a chart](/chart/interactive/docs/customizing_charts)\nto fit the look and feel of your website. Charts are highly interactive and expose\n[events](/chart/interactive/docs/events) that let you connect them to create complex\n[dashboards](/chart/interactive/docs/gallery/controls) or other experiences\n[integrated with your\nwebpage](/chart/interactive/docs/examples#full_html_page_example).\nCharts are rendered using HTML5/SVG technology to provide cross-browser compatibility\n(including VML for older IE versions) and cross platform portability to iPhones,\niPads, and Android. Your users will never have to mess with plugins or any software.\nIf they have a web browser, they can see your charts.\n\nAll chart types are populated with data using the\n[DataTable](/chart/interactive/docs/reference#DataTable) class,\nmaking it easy to switch between chart types as you experiment to find the ideal appearance.\nThe DataTable provides methods for sorting, modifying, and filtering data, and can be\npopulated directly from your web page, a database, or any data provider supporting the\n[Chart Tools Datasource](/chart/interactive/docs/queries) protocol.\n(That protocol includes a SQL-like query language and is implemented by Google Spreadsheets,\nGoogle Fusion Tables and third party data providers such as SalesForce.\nYou can even implement the protocol on your own website and become a data provider\nfor other services.)\n\n**Ready to create your first chart? Visit the\n[quickstart](/chart/interactive/docs/quick_start).**\n\nOur tools are constantly evolving to better address your needs;\nwe depend on your feedback to help us prioritize which features to include.\nJoin our [discussion group](http://groups.google.com/group/google-visualization-api)."]]