
تأخذ الدالة PLACES_COUNT_PER_H3 منطقة جغرافية للبحث وتعرض جدولاً يتضمّن عدد الأماكن لكل خلية H3 في منطقة البحث.
بما أنّ الدالة PLACES_COUNT_PER_H3 تعرض جدولاً، استدعِها باستخدام عبارة FROM.
مَعلمات الإدخال:
مطلوبة:
geographyمَعلمة الفلتر التي تحدّد مساحة البحث. المَعلمةgeographyهي قيمة يحدّدها نوع البياناتGEOGRAPHYفي BigQuery، وهو نوع بيانات يتيح استخدام النقاط والخطوط المتعددة الأجزاء والمضلّعات.للاطّلاع على أمثلة حول استخدام أنواع مختلفة من المواقع الجغرافية للبحث، مثل منافذ العرض والخطوط، يمكنك الاطّلاع على دالة
PLACES_COUNT.مطلوبة:
h3_resolutionمَعلمة الفلتر التي تحدّد دقة H3 المستخدَمة لتجميع عدد الأماكن في كل خلية H3. تتراوح القيم المسموح بها بين 0 و11.اختياري: مَعلمات فلتر إضافية لتحسين عملية البحث.
المرتجعات:
- جدول يتضمّن صفًا واحدًا لكل خلية H3. يحتوي الجدول على الأعمدة
h3_cell_index(STRING) وgeography(GEOGRAPHY) التي تحدّد المضلّع الذي يمثّل خلية H3، وcount(INT64)، وplace_ids(ARRAY<STRING>) حيث يحتويplace_idsعلى ما يصل إلى 250 معرّف مكان لكل خلية H3.
- جدول يتضمّن صفًا واحدًا لكل خلية H3. يحتوي الجدول على الأعمدة
مثال: عدد المتاجر الصغيرة ومتاجر البقالة التي يمكن الوصول إليها باستخدام الكراسي المتحركة لكل خلية H3
يحسب المثال أدناه عدد المتاجر الصغيرة ومتاجر البقالة التي يمكن الوصول إليها بواسطة الكراسي المتحركة والتي تعمل في كل خلية H3 في مدينة نيويورك. تستخدم خلايا H3 مستوى دقة يبلغ 8.
يستخدم هذا المثال بيانات Overture Maps مجموعة البيانات المتاحة للجميع في BigQuery للحصول على الجغرافيا الخاصة بمدينة نيويورك.
DECLARE geo GEOGRAPHY;

-- Get the geography for New York City.
SET geo = (SELECT geometry FROM `bigquery-public-data.overture_maps.division_area`
  WHERE country = 'US' AND subtype = 'locality' AND names.primary = 'New York'  LIMIT 1);

SELECT * FROM `PROJECT_NAME.places_insights___us.PLACES_COUNT_PER_H3`(
  JSON_OBJECT(
      'geography', geo,
      'types', ["convenience_store","grocery_store"],
      'wheelchair_accessible_entrance', true,
      'business_status', ['OPERATIONAL'],
      'h3_resolution', 8
    )
);
الردّ على الدالة:
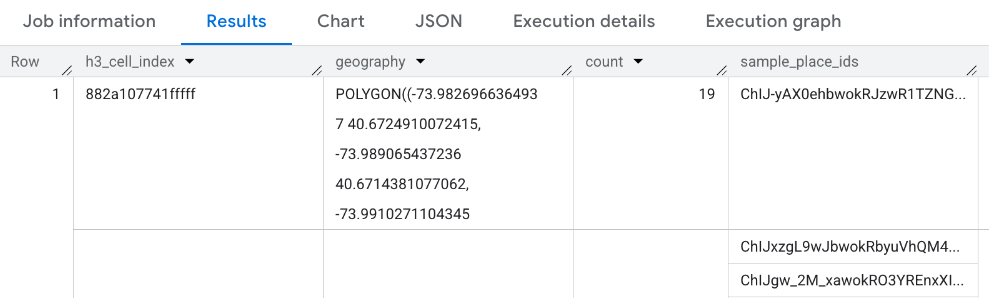
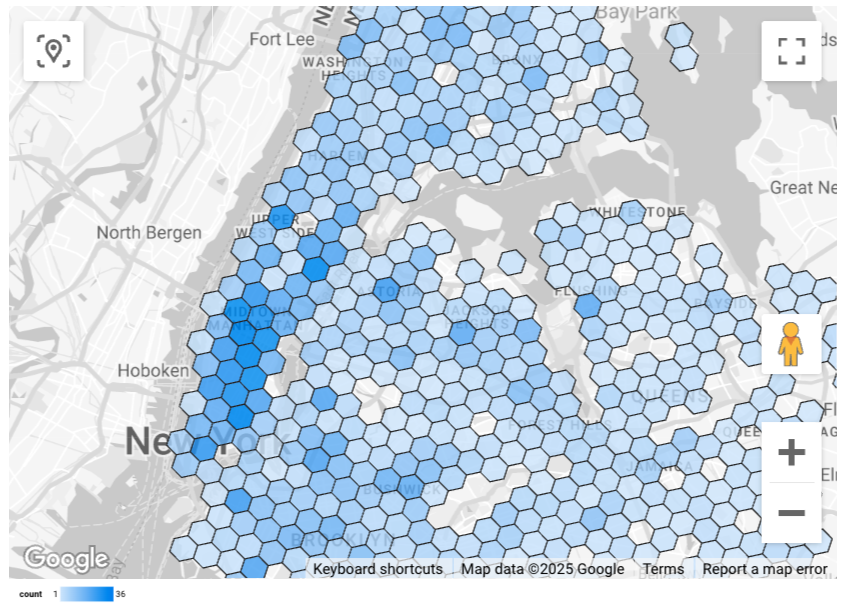
عرض النتائج
تعرض الصور التالية هذه البيانات في Looker Studio كخريطة مملوءة. كلما كانت خلية H3 أغمق، زاد تركيز النتائج:
لاستيراد بياناتك إلى Looker Studio، اتّبِع الخطوات التالية:
نفِّذ الدالة أعلاه لإنشاء النتائج.
في نتائج BigQuery، انقر على فتح في -> Looker Studio. يتم استيراد نتائجك تلقائيًا إلى Looker Studio.
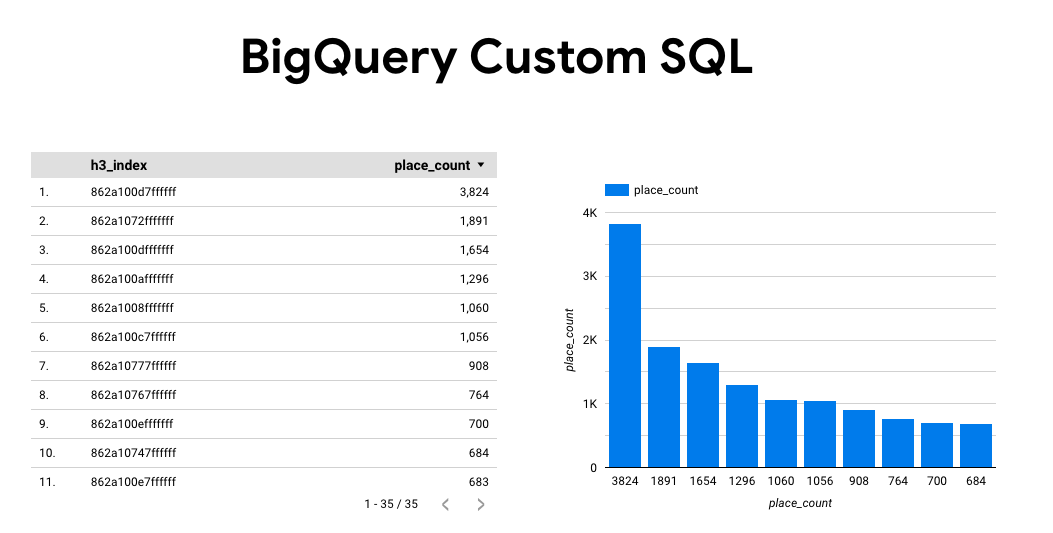
تنشئ Looker Studio صفحة تقرير تلقائية وتضبطها باستخدام عنوان وجدول ورسم بياني شريطي للنتائج.
اختَر كل محتوى الصفحة واحذفه.
انقر على إدراج -> خريطة مملوءة لإضافة خريطة مملوءة إلى تقريرك.
ضمن أنواع الرسوم البيانية -> الإعداد، اضبط الحقول كما هو موضّح أدناه:
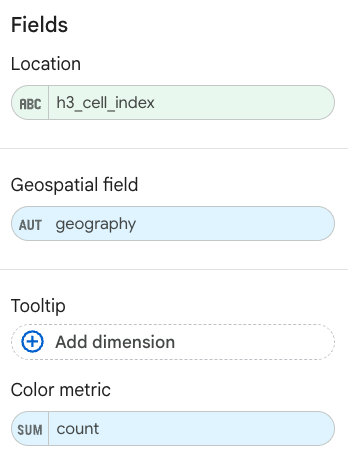
يظهر الخريطة المملوءة كما هو موضح أعلاه. يمكنك اختياريًا النقر على أنواع الرسوم البيانية -> الأنماط لضبط مظهر الخريطة بشكلٍ أكبر.
لمزيد من المعلومات والأمثلة حول عرض نتائج إحصاءات الأماكن بشكل مرئي، يُرجى الاطّلاع على عرض نتائج طلب البحث بشكل مرئي.