Zadbaj o dobrą organizację dzięki kolekcji
Zapisuj i kategoryzuj treści zgodnie ze swoimi preferencjami.
Deweloperzy z Europejskiego Obszaru Gospodarczego (EOG)
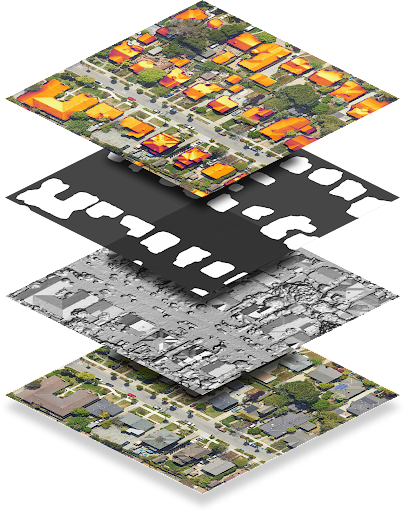
Punkt końcowy dataLayers zwraca dane zakodowane jako pliki GeoTIFF, które można wykorzystać w dowolnej aplikacji systemu informacji geograficznej (GIS) do projektowania systemów solarnych.
Każdy ciąg znaków w odpowiedzi dataLayers zawiera adres URL, którego możesz użyć do pobrania odpowiedniego pliku GeoTIFF. Adresy URL są ważne przez maksymalnie godzinę od momentu wygenerowania na podstawie pierwotnego żądania warstw danych. Pliki GeoTIFF mogą być przechowywane przez maksymalnie 30 dni.
Z wyjątkiem warstwy RGB pliki GeoTIFF nie są prawidłowo wyświetlane w przeglądarce obrazów, ponieważ zawierają zakodowane dane, a nie obrazy RGB. Plików GeoTIFF nie można też używać bezpośrednio jako obrazu nakładki w interfejsie Maps JavaScript API.
Poniższa tabela zawiera szczegółowy opis każdej warstwy.
Warstwa
Głębia piksela
Rozdzielczość
Opis
Cyfrowy model powierzchni (DSM)
Liczba zmiennoprzecinkowa 32-bitowa
0,1 m/piksel
Dane o wysokości, które przedstawiają topografię powierzchni Ziemi, w tym elementy naturalne i stworzone przez człowieka. Wartości są podawane w metrach nad poziomem morza. Nieprawidłowe lokalizacje lub obszary, dla których nie mamy danych, są przechowywane jako -9999.
Zdjęcie regionu z lotu ptaka. Plik obrazu GeoTIFF zawiera 3 pasma odpowiadające wartościom czerwonym, zielonym i niebieskim, które tworzą 24-bitową wartość RGB dla każdego piksela.
Domyślna rozdzielczość piksela to 0,1 m/piksel.
Maska budynku
1-bitowy
0,1 m/piksel
Jeden bit na piksel wskazujący, czy dany piksel jest uznawany za część dachu.
Roczny strumień
Liczba zmiennoprzecinkowa 32-bitowa
0,1 m/piksel
Mapa rocznego strumienia energii słonecznej lub rocznego nasłonecznienia dachów w regionie.
Wartości są podawane w kWh/kW/rok.
Wartość strumienia jest obliczana dla każdej lokalizacji, a nie tylko dla dachów budynków. Nieprawidłowe lokalizacje lub obszary, w których nie udało się obliczyć strumienia, są przechowywane jako -9999. Lokalizacje poza naszym obszarem obsługi są nieprawidłowe.
Uwaga: jest to strumień bez maskowania.
Miesięczny przepływ
Liczba zmiennoprzecinkowa 32-bitowa
0,5 m/piksel
Miesięczna mapa strumienia (światło słoneczne padające na dachy, podzielone według miesięcy) w regionie. Wartości są podawane w kWh/kW/rok. Plik obrazu GeoTIFF zawiera 12 pasów odpowiadających kolejno miesiącom od stycznia do grudnia.
Cień co godzinę
Liczba całkowita 32-bitowa
1 m/piksel
12 adresów URL godzinowych map cienia odpowiadających okresowi od stycznia do grudnia w odpowiedniej kolejności.
Każdy plik GeoTIFF zawiera 24 pasma odpowiadające 24 godzinom doby. Każdy piksel to 32-bitowa liczba całkowita odpowiadająca (maksymalnie) 31 dniom danego miesiąca. Wartość 1 bit oznacza, że w danym dniu, o danej godzinie i w danym miesiącu w odpowiednim miejscu widać słońce.
Nieprawidłowe lokalizacje są przechowywane jako -9999 i mają ustawiony bit 31, ponieważ odpowiada to 32 dniowi miesiąca, a więc jest nieprawidłowe.
Dekodowanie rastrów cienia godzinowego
Dane dotyczące zacienienia w poszczególnych godzinach są kodowane w rastrach wielopasmowych. Więcej informacji o podstawach rastrów znajdziesz w koncepcjach interfejsu Solar API.
Gdy poprosisz o godzinowe dane dotyczące zacienienia, możesz otrzymać maksymalnie 12 rastrów – po jednym na każdy miesiąc roku kalendarzowego (od stycznia do grudnia). Każdy raster składa się z 24 warstw, czyli pasm, które odpowiadają 24 godzinom doby.
Każde pasmo jest reprezentowane przez macierz komórek, czyli pikseli. Każdy piksel ma głębię 32 bitów, co odpowiada (maksymalnie) 31 dniom miesiąca.
Aby odczytać dane o cieniu z podziałem na dzień, godzinę i miesiąc, musisz znać analizowany bit, pasmo i raster.
Aby na przykład sprawdzić, czy w danym miejscu o współrzędnych (x, y) 22 czerwca o godzinie 16:00 było słońce, wykonaj te czynności:
Wysyłanie żądania dotyczącego warstw danych dla wszystkich warstw w lokalizacji (x, y).
Ponieważ czerwiec jest szóstym miesiącem roku, pobierz szósty adres URL z listy hourlyShadeUrls.
Przedziały godzinowe są podawane w formacie 24-godzinnym. Aby uzyskać dane z godziny 16:00, wyszukaj 17 kanał.
Indeks bitów (dni) od 0. Aby uzyskać dane z 22 czerwca, odczytaj bit 21.
Bity zawierają dane binarne wskazujące, czy w danym miejscu w określonym dniu i o określonej godzinie było słońce. Jeśli bit ma wartość 1, w danym miejscu było słońce. Jeśli bit ma wartość 0, w tej lokalizacji było zacienienie.
[null,null,["Ostatnia aktualizacja: 2025-08-27 UTC."],[[["\u003cp\u003eThe dataLayers endpoint provides access to various geographical data layers like elevation, aerial imagery, and solar potential, encoded in GeoTIFF format for use in GIS applications.\u003c/p\u003e\n"],["\u003cp\u003eGeoTIFF URLs are valid for one hour and the downloaded files can be stored for up to 30 days, with most layers requiring specialized software for proper visualization due to data encoding.\u003c/p\u003e\n"],["\u003cp\u003eThe hourly shade layer is encoded to indicate sun exposure for each location at a specific time and day of the month, requiring bitwise operations to decode the information.\u003c/p\u003e\n"],["\u003cp\u003eThe hourly shade data uses the location's regional time zone, assumes no leap days or daylight savings, and treats all days as 24 hours long with standard time noon.\u003c/p\u003e\n"]]],["The `dataLayers` endpoint provides GeoTIFF files for solar system design, accessible via URLs valid for one hour, and storable for 30 days. These files include: Digital Surface Model (DSM) for elevation; RGB imagery; Building mask indicating rooftop pixels; Annual flux showing annual sunlight; Monthly flux with sunlight data per month and hourly shade containing 12 rasters, with 24 layers for each hour of the day each month, each one represented by bits indicating whether the location saw the sun on a given day, hour and month.\n"],null,["# About GeoTIFF files\n\n**European Economic Area (EEA) developers** If your billing address is in the European Economic Area, effective on 8 July 2025, the [Google\n| Maps Platform EEA Terms of Service](https://cloud.google.com/terms/maps-platform/eea) will apply to your use of the Services. [Learn more](/maps/comms/eea/faq). In addition, certain content from the Solar API will no longer be returned. [Learn more](/maps/comms/eea/solar).\n\nThe [dataLayers](/maps/documentation/solar/data-layers) endpoint\nreturns data encoded as GeoTIFF files, which can be used in any geographic\ninformation system (GIS) application to design solar systems.\n\nEach string in the dataLayers response contains a URL, which you can\nuse to fetch the corresponding GeoTIFF. URLs are valid for up to an hour after\nthey are generated from the original data layers request. GeoTIFF files can be\nstored for up to 30 days.\n\nWith the exception of the RGB layer, GeoTIFF files don't display correctly with\nan image viewer, as the content is encoded data rather than RGB images. GeoTIFF\nfiles also cannot be used directly as an overlay image with Maps Javascript API.\n\nThe following table describes each layer in detail.\n\n| Layer | Pixel depth | Resolution | Description |\n|-----------------------------|----------------|------------------------------------------------|---------------------------------------------------------------------------------------------------------------------------------------------------------------------------------------------------------------------------------------------------------------------------------------------------------------------------------------------------------------------------------------------------------------------------------------------------------------------------------------------------------------|\n| Digital Surface Model (DSM) | 32-bit float | 0.1 m/pixel | Elevation data that represents the topography of Earth's surface, including natural and built features. Values are in meters above sea level. Invalid locations, or areas where we don't have data, are stored as -9999. |\n| RGB | 8-bit | 0.1 m/pixel 0.25 m/pixel 0.5 m/pixel 1 m/pixel | An aerial image of the region. The GeoTIFF imagery file contains three bands corresponding to red, green and blue values in order to form 24-bit RGB value for each pixel. By default, the pixel resolution is 0.1 m/pixel. |\n| Building mask | 1-bit | 0.1 m/pixel | One bit per pixel indicating whether that pixel is considered to be part of a rooftop. |\n| Annual flux | 32-bit float | 0.1 m/pixel | The annual flux map, or annual sunlight on roofs, of the region. Values are kWh/kW/year. Flux is computed for every location, not just building rooftops. Invalid locations, or areas where we couldn't calculate flux, are stored as -9999. Locations outside our [coverage area](/maps/documentation/solar/coverage) are invalid. **Note:** This is unmasked flux. |\n| Monthly flux | 32-bit float | 0.5 m/pixel | The monthly flux map (sunlight on roofs, broken down by month) of the region. Values are kWh/kW/year. The GeoTIFF imagery file contains 12 bands corresponding to January --- December, in order. |\n| Hourly shade | 32-bit integer | 1 m/pixel | 12 URLs for hourly shade maps corresponding to January --- December, in order. Each GeoTIFF file contains 24 bands, corresponding to the 24 hours of the day. Each pixel is a 32 bit integer, corresponding to the (up to) 31 days of that month. A 1 bit means that the corresponding location is able to see the sun on that day, at that hour, in that month. \u003cbr /\u003e Invalid locations are stored as -9999 and have bit 31 set, as that corresponds to the 32nd day of the month and is therefore invalid. |\n\nDecode hourly shade rasters\n---------------------------\n\nHourly shade data is encoded in multiband rasters. To learn more about raster\nbasics, see [Solar API Concepts](/maps/documentation/solar/concepts).\n\nWhen you make a request for hourly shade data, you can receive up to 12 rasters,\none for each month of the calendar year (January through December). Each raster\nis composed of 24 layers, or *bands*, which correspond to the 24 hours of the\nday.\n\nEach band is represented by a matrix of cells, or *pixels*. Each pixel has a\ndepth of 32 bits, which correspond to the (maximum) 31 days of the month.\nDecoding the day, time, and month of shade data, therefore, requires\nunderstanding the bit, band, and raster that you are analyzing.\n\nFor example, to identify whether a given location at coordinates (x, y) saw the\nsun at 4:00 PM on June 22, do the following:\n\n1. Make a data layers request for all layers for location (x, y).\n2. Because the month of June is the sixth month of the year, fetch the sixth URL in the `hourlyShadeUrls` list.\n3. Hourly bands are given in 24-hour time. To get data for 4:00 PM (16:00), look up the 17th channel.\n4. Bits (days) index from 0. To get data for the 22nd day of June, read bit 21.\n5. Bits provide binary data indicating whether that location saw sun at the given date and time. If the bit is 1, the location saw sun. If the bit is 0, the location saw shade.\n\nThe following code summarizes the steps above: \n\n```transact-sql\n(hourly_shade[month - 1])(x, y)[hour] & (1 \u003c\u003c (day - 1))\n```\n| **Note:** Hourly shade data is based on the regional time zone of the requested location. Hourly shade data also assumes that there are no leap days and that Daylight Savings Time does not exist. All days are assumed to be 24 hours long and noon is always \"standard time\" noon (12:00)."]]