
Конечная точка dataLayers возвращает данные, закодированные в виде файлов GeoTIFF, которые можно использовать в любом приложении географической информационной системы (ГИС) для проектирования солнечных электростанций.
Каждая строка в ответе dataLayers содержит URL-адрес, который можно использовать для получения соответствующего файла GeoTIFF. URL-адреса действительны в течение часа после их генерации из исходного запроса слоев данных. Файлы GeoTIFF могут храниться до 30 дней.
За исключением слоя RGB, файлы GeoTIFF отображаются некорректно в программах просмотра изображений, поскольку их содержимое представляет собой закодированные данные, а не изображения RGB. Кроме того, файлы GeoTIFF нельзя использовать напрямую в качестве наложения изображения с помощью API JavaScript для карт.
В таблице ниже подробно описан каждый слой.
| Слой | глубина пикселя | Разрешение | Описание |
|---|---|---|---|
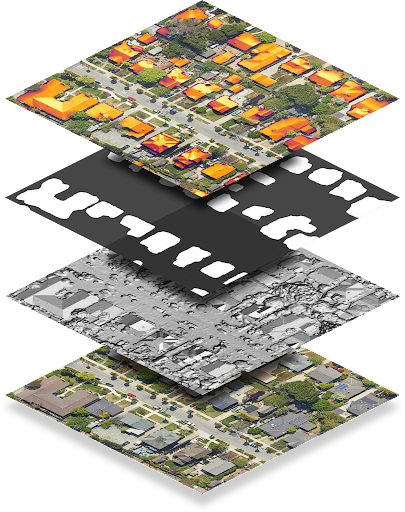
| Цифровая модель поверхности (ЦМР) | 32-битное число с плавающей запятой | 0,1 м/пиксель | Данные о высоте, отражающие топографию поверхности Земли, включая природные и рукотворные объекты. Значения указаны в метрах над уровнем моря. Неверные местоположения или области, по которым отсутствуют данные, сохраняются как -9999. |
| RGB | 8-битный | 0,1 м/пиксель 0,25 м/пиксель | Аэрофотоснимок или спутниковое изображение региона. Файл изображения GeoTIFF содержит три канала, соответствующие значениям красного, зеленого и синего цветов, для формирования 24-битного значения RGB для каждого пикселя. По умолчанию разрешение в пикселях составляет 0,1 м/пиксель. |
| Строительство маски | 1-бит | 0,1 м/пиксель | Один бит на пиксель указывает, считается ли этот пиксель частью крыши. |
| Годовой поток | 32-битное число с плавающей запятой | 0,1 м/пиксель | Карта годового потока солнечного света на крышах региона. Значения указаны в кВт·ч/кВт/год. Поток рассчитывается для каждого местоположения, а не только для крыш зданий. Недействительные местоположения или области, где мы не смогли рассчитать поток, сохраняются как -9999. Местоположения за пределами нашей зоны покрытия считаются недействительными. Примечание: это незамаскированный поток. |
| Ежемесячный поток | 32-битное число с плавающей запятой | 0,5 м/пиксель | Карта ежемесячных потоков солнечного света (солнечный свет на крышах, с разбивкой по месяцам) в регионе. Значения указаны в кВт·ч/кВт·год. Файл изображения GeoTIFF содержит 12 полос, соответствующих периоду с января по декабрь в указанном порядке. |
| Почасовая тень | 32-битное целое число | 1 м/пиксель | 12 URL-адресов для почасовых карт затенения, соответствующих периоду с января по декабрь, в указанном порядке. Каждый файл GeoTIFF содержит 24 канала, соответствующих 24 часам суток. Каждый пиксель представляет собой 32-битное целое число, соответствующее (до) 31 дню этого месяца. Бит 1 означает, что в соответствующем месте можно наблюдать солнце в этот день, в этот час, в этом месяце. Недопустимые адреса сохраняются как -9999, и для них установлен бит 31, поскольку это соответствует 32-му дню месяца и, следовательно, является недопустимым. |
Расшифровка почасовых растров оттенков
Почасовые данные о затенении закодированы в многоканальных растрах. Для получения дополнительной информации об основах работы с растрами см. раздел «Концепции Solar API» .
При запросе почасовых данных о затенении вы можете получить до 12 растровых изображений, по одному на каждый месяц календарного года (с января по декабрь). Каждое растровое изображение состоит из 24 слоев, или полос , которые соответствуют 24 часам суток.
Каждый диапазон представлен матрицей ячеек, или пикселей . Каждый пиксель имеет глубину 32 бита, что соответствует (максимум) 31 дню месяца. Таким образом, для расшифровки данных о дне, времени и месяце затенения необходимо понимать, какой бит, диапазон и растр вы анализируете.
Например, чтобы определить, было ли солнце в заданной точке с координатами (x, y) в 16:00 22 июня, выполните следующие действия:
- Выполните запрос на получение данных по всем слоям для местоположения (x, y).
- Поскольку июнь — шестой месяц года, получите шестой URL-адрес из списка
hourlyShadeUrls. - Почасовые интервалы указаны в 24-часовом формате. Чтобы получить данные на 16:00 (4:00), найдите 17-й канал.
- Биты (дни) индексируются с 0. Чтобы получить данные за 22 июня, прочтите бит 21.
- Биты представляют собой двоичные данные, указывающие, было ли в данном месте солнце в заданную дату и время. Если бит равен 1, то в данном месте было солнце. Если бит равен 0, то в данном месте была тень.
Следующий код суммирует описанные выше шаги:
(hourly_shade[month - 1])(x, y)[hour] & (1 << (day - 1))