
Der dataLayers-Endpunkt gibt Daten zurück, die als GeoTIFF-Dateien codiert sind. Diese können in jeder GIS-Anwendung (Geographic Information System) verwendet werden, um Solaranlagen zu planen.
Jeder String in der dataLayers-Antwort enthält eine URL, mit der Sie das entsprechende GeoTIFF abrufen können. URLs sind bis zu einer Stunde nach der Generierung aus der ursprünglichen Anfrage für Datenlayer gültig. GeoTIFF-Dateien können bis zu 30 Tage lang gespeichert werden.
Mit Ausnahme der RGB-Ebene werden GeoTIFF-Dateien in einer Bildanzeige nicht korrekt dargestellt, da es sich bei den Inhalten um codierte Daten und nicht um RGB-Bilder handelt. GeoTIFF-Dateien können auch nicht direkt als Overlay-Bild mit der Maps JavaScript API verwendet werden.
In der folgenden Tabelle werden die einzelnen Ebenen detailliert beschrieben.
| Ebene | Pixeltiefe | Auflösung | Beschreibung |
|---|---|---|---|
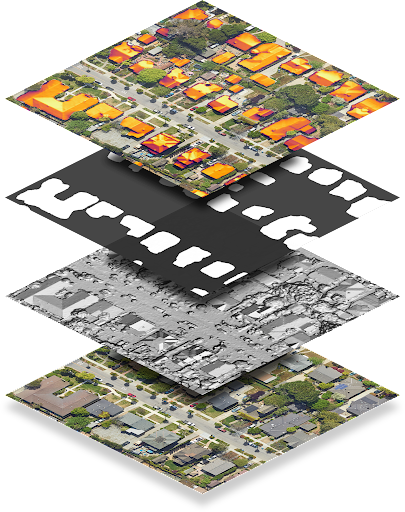
| Digitales Oberflächenmodell (DOM) | 32-Bit-Gleitkommazahl | 0,1 m/Pixel | Höhendaten, die die Topografie der Erdoberfläche darstellen, einschließlich natürlicher und künstlicher Merkmale. Die Werte werden in Metern über dem Meeresspiegel angegeben. Ungültige Standorte oder Bereiche, für die keine Daten verfügbar sind, werden als -9999 gespeichert. |
| RGB | 8-Bit | 0,1 m/Pixel 0,25 m/Pixel |
Eine Luft- oder Satellitenaufnahme der Region. Die GeoTIFF-Bilddatei enthält drei Bänder, die den Rot-, Grün- und Blauwerten entsprechen, um für jedes Pixel einen 24-Bit-RGB-Wert zu bilden. Standardmäßig beträgt die Pixelauflösung 0,1 m/Pixel. |
| Gebäudemaske | 1 Bit | 0,1 m/Pixel | Ein Bit pro Pixel, das angibt, ob das Pixel als Teil eines Daches betrachtet wird. |
| Jährlicher Fluss | 32-Bit-Gleitkommazahl | 0,1 m/Pixel | Die Karte des jährlichen Flusses oder der jährlichen Sonneneinstrahlung auf Dächern in der Region.
Die Werte werden in kWh/kW/Jahr angegeben. Der Fluss wird für jeden Standort berechnet, nicht nur für Gebäudedächer. Ungültige Standorte oder Bereiche, in denen wir den Fluss nicht berechnen konnten, werden als „-9999“ gespeichert. Standorte außerhalb unseres Abdeckungsbereichs sind ungültig. Hinweis:Dies ist der nicht maskierte Fluss. |
| Monatlicher Fluss | 32-Bit-Gleitkommazahl | 0,5 m/Pixel | Die monatliche Flusskarte (Sonnenlicht auf Dächern, aufgeschlüsselt nach Monat) der Region. Die Werte werden in kWh/kW/Jahr angegeben. Die GeoTIFF-Bilddatei enthält 12 Bänder, die in der Reihenfolge den Monaten Januar bis Dezember entsprechen. |
| Stündliche Schattierung | 32-Bit-Ganzzahl | 1 m/Pixel | 12 URLs für stündliche Schattenkarten für Januar bis Dezember in der entsprechenden Reihenfolge. Jede GeoTIFF-Datei enthält 24 Bänder, die den 24 Stunden des Tages entsprechen. Jeder Pixel ist eine 32-Bit-Ganzzahl, die den (bis zu) 31 Tagen des jeweiligen Monats entspricht. Eine 1 bedeutet, dass an dem entsprechenden Ort an diesem Tag, zu dieser Stunde und in diesem Monat die Sonne zu sehen ist. Ungültige Standorte werden als -9999 gespeichert und haben Bit 31 gesetzt, da dies dem 32. Tag des Monats entspricht und daher ungültig ist. |
Stündliche Schattenraster dekodieren
Stündliche Schatteninformationen werden in Multibandrastern codiert. Weitere Informationen zu Rastergrundlagen finden Sie unter Solar API-Konzepte.
Wenn Sie stündliche Schatteninformationen anfordern, können Sie bis zu 12 Raster erhalten, eines für jeden Monat des Kalenderjahres (Januar bis Dezember). Jedes Raster besteht aus 24 Layern oder Bändern, die den 24 Stunden des Tages entsprechen.
Jedes Band wird durch eine Matrix von Zellen oder Pixeln dargestellt. Jeder Pixel hat eine Tiefe von 32 Bit, was den (maximal) 31 Tagen des Monats entspricht. Um den Tag, die Uhrzeit und den Monat der Schatteninformationen zu decodieren, müssen Sie daher den Bit, das Band und das Raster kennen, die Sie analysieren.
So ermitteln Sie beispielsweise, ob an einem bestimmten Ort mit den Koordinaten (x, y) am 22. Juni um 16:00 Uhr die Sonne schien:
- Stellen Sie eine Anfrage für alle Daten-Overlays für den Standort (x, y).
- Da Juni der sechste Monat des Jahres ist, wird die sechste URL in der Liste
hourlyShadeUrlsabgerufen. - Stündliche Bereiche werden im 24‑Stunden-Format angegeben. Wenn Sie Daten für 16:00 Uhr abrufen möchten, suchen Sie nach dem 17. Channel.
- Index für Bits (Tage) ab 0. Wenn Sie Daten für den 22. Juni abrufen möchten, lesen Sie Bit 21.
- Die Bits enthalten binäre Daten, die angeben, ob an diesem Ort zu dem angegebenen Datum und der angegebenen Uhrzeit die Sonne schien. Wenn das Bit 1 ist, hat die Sonne an diesem Ort geschienen. Wenn das Bit 0 ist, war der Standort im Schatten.
Der folgende Code fasst die oben genannten Schritte zusammen:
(hourly_shade[month - 1])(x, y)[hour] & (1 << (day - 1))