
定期查看 Google Maps Platform 的 API 用量、配额和结算信息很重要。这些信息可帮助您衡量 API 的用量,确保不超出预设的用量限制,并通过预算规划来控制费用。您还可以从这些信息中获得相关提醒,及时了解您的应用与 Google Maps Platform 服务之间可能发生的任何意外互动。
Maps Platform 提供了两种工具来帮助您查看用量、配额和结算信息:
- 报告:一组预定义的可视化报告,可让您在 Google Cloud 控制台中轻松查看基本的 API 用量、配额和结算信息。您可以快速确定 API 调用的次数,了解剩余的 API 用量配额,以及监控一段时间内的用量结算情况。
Monitoring:一组通过 Cloud 控制台和 API 提供的工具,可让您监控 API 用量、配额和结算信息,还可以设定提醒,在其中任一指标接近预设的限制时发出通知。
借助 Monitoring,您可以创建自定义的监控信息中心,以不同的图表类型显示各项指标,还可以设置在某个指标超过预设的阈值时发出电子邮件或短信等提醒通知。
报告
Maps Platform 中的报告工具提供了一组预定义的可视化报告,可让您在 Cloud 控制台中轻松查看基本的 API 用量、配额和结算信息。您可以使用 Cloud 控制台查看有关 Maps Platform 的 API 用量、配额和结算数据的报告。
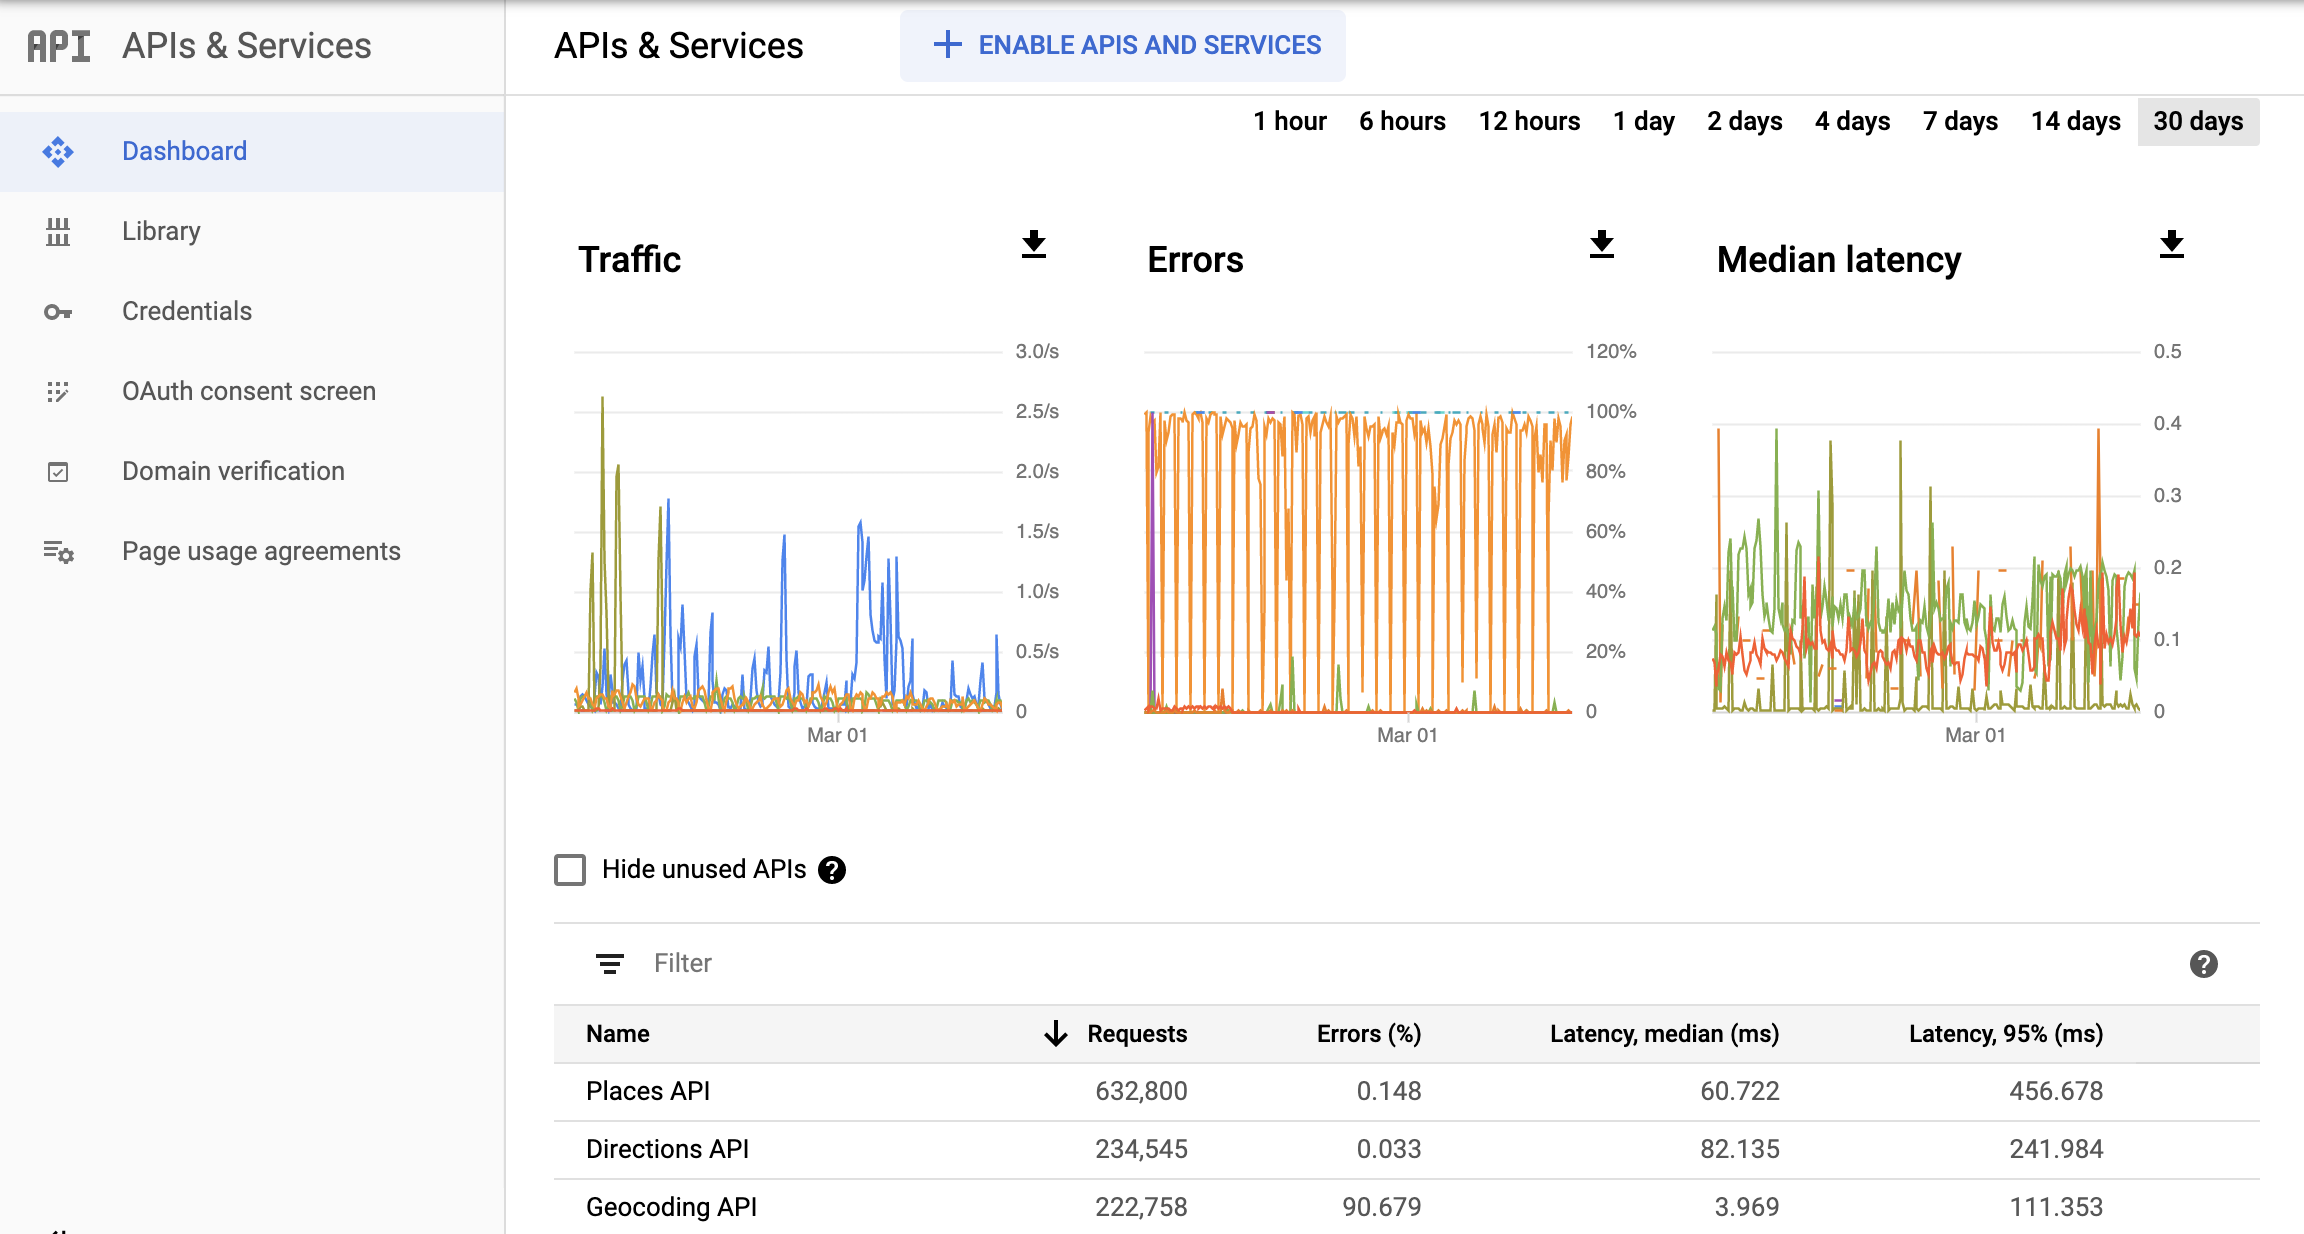
API 和服务报告
Cloud 控制台中的 API 和服务报告会显示您已为项目启用的所有 API(包括 Maps Platform 的各个 API 和 SDK 以及所有其他 Google API 和服务)的用量指标。
下图显示了 API 和服务报告。
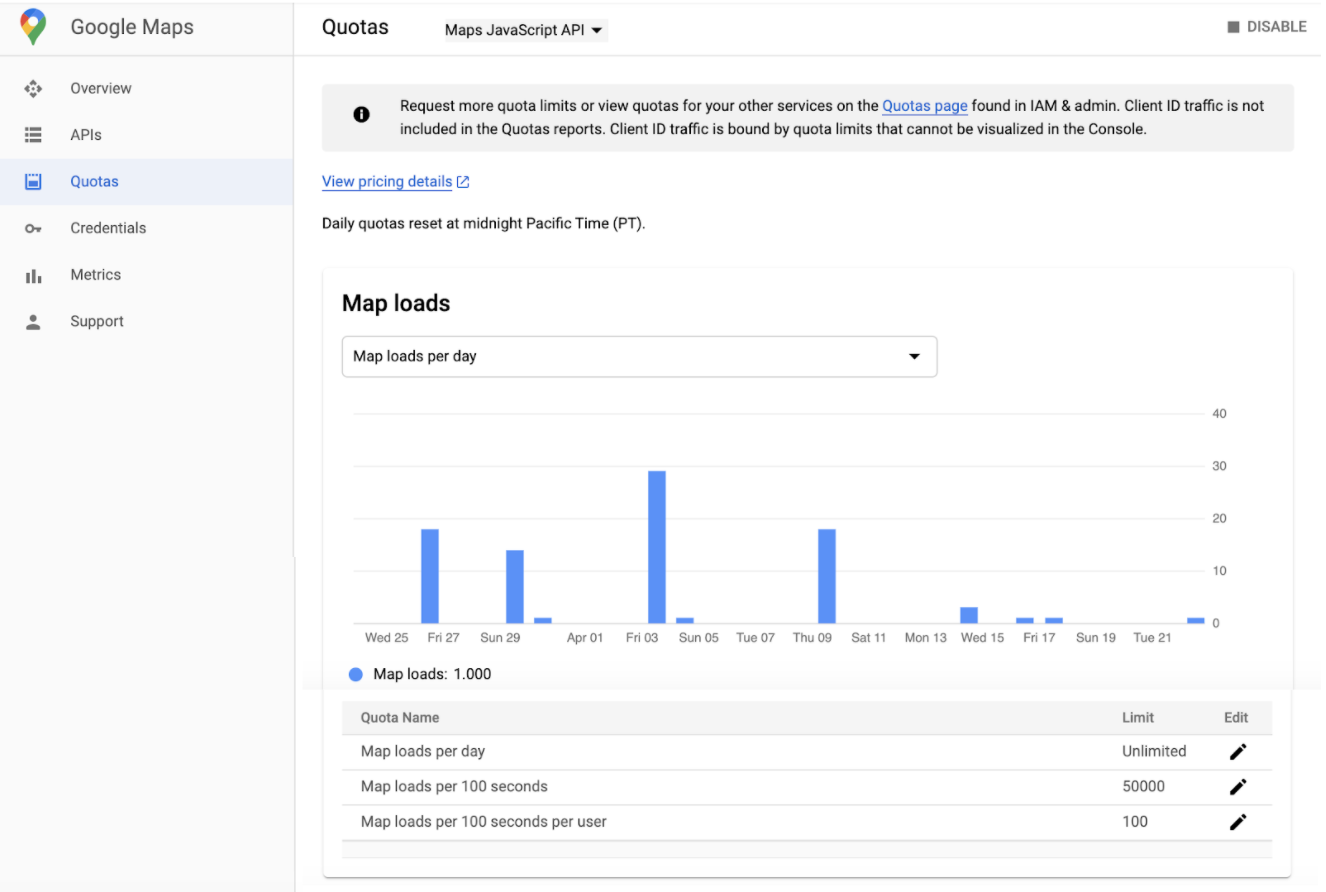
配额
配额用于限制项目可以向 Maps Platform 各 API 发出的请求数。您可以通过以下三种方式限制请求数:
- 每天
- 每分钟
- 每位用户每分钟(如果有)
只有成功的请求和导致服务器错误的请求才会计入配额。未通过身份验证的请求不计入配额。
配额用量以图表形式显示在 Cloud 控制台中的配额报告页面上。
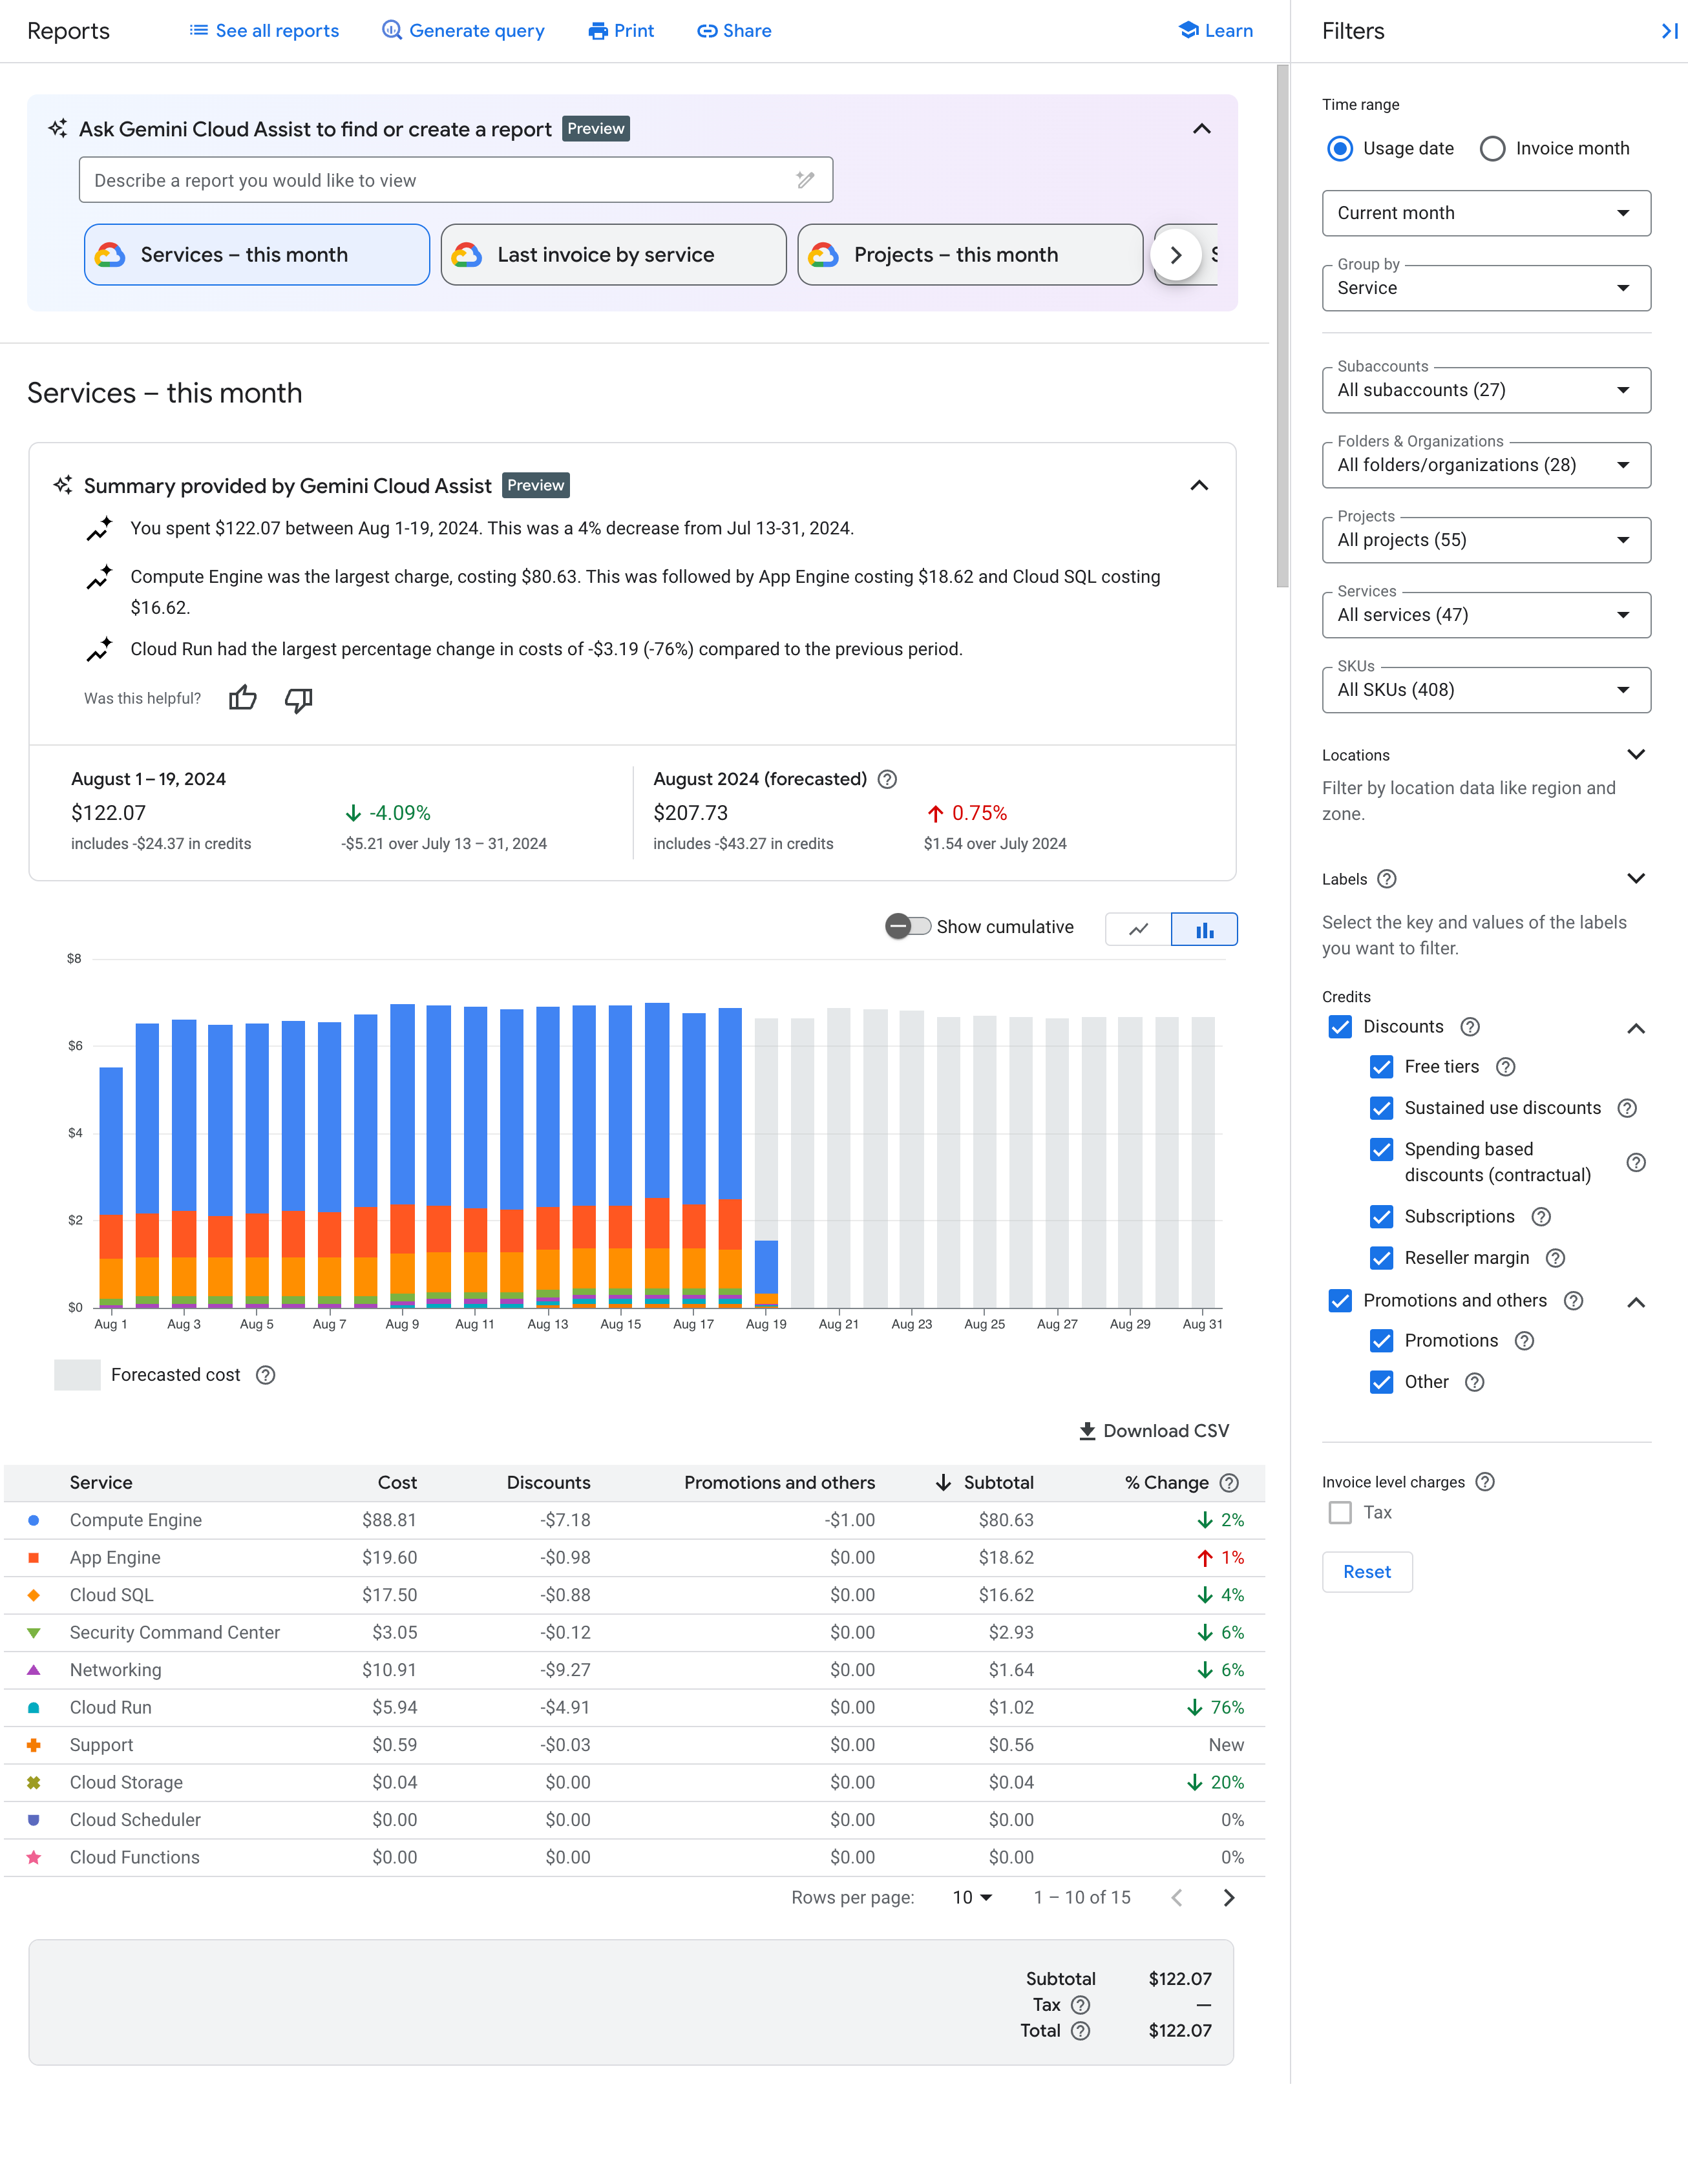
结算
Cloud 控制台中的结算报告提供所选项目的结算及相关费用信息。
在 Cloud Billing 的“报告”页面中,您可以查看与某个 Cloud Billing 账号关联的所有项目的 Google Cloud 使用费。为方便查看重要的费用趋势,您可以选择数据范围,指定时间范围,配置图表过滤条件,以及按项目、服务、SKU 或位置进行分组。
Cloud Billing 报告可以帮助您回答如下问题:
- 本月的 Google Cloud 支出趋势如何?
- 上个月哪个项目的费用最高?
- 根据历史趋势,未来的费用预计是多少?
- 我在各个区域的支出是多少?
下图显示了结算报告。
监控
Cloud Monitoring 会收集您的服务和您使用的 Google Cloud 资源的测量结果。例如,您可以监控指定时间间隔内的 API 调用次数或配额用量。
您不仅可以设定自定义指标和图表,还可以设定提醒。提醒可用于在服务的表现不符合您设定的标准时发送通知。例如,您可以通过电子邮件或短信等方式向 Cloud 控制台移动应用和选择的其他平台发送通知。
指标
在 Cloud Monitoring 中:
- 指标描述的是衡量的内容,例如某个 API 的调用次数、已使用的用量配额百分比或虚拟机的 CPU 利用率。
- 时序是一种数据结构,包含带时间戳的指标衡量数据以及关于这些衡量数据的来源和含义的信息。
如需探索指标数据,请使用 Metrics Explorer 创建图表。例如,如需查看某个 API 在过去一小时内每分钟的请求数,请使用 Metrics Explorer 创建一个图表来显示最新数据。
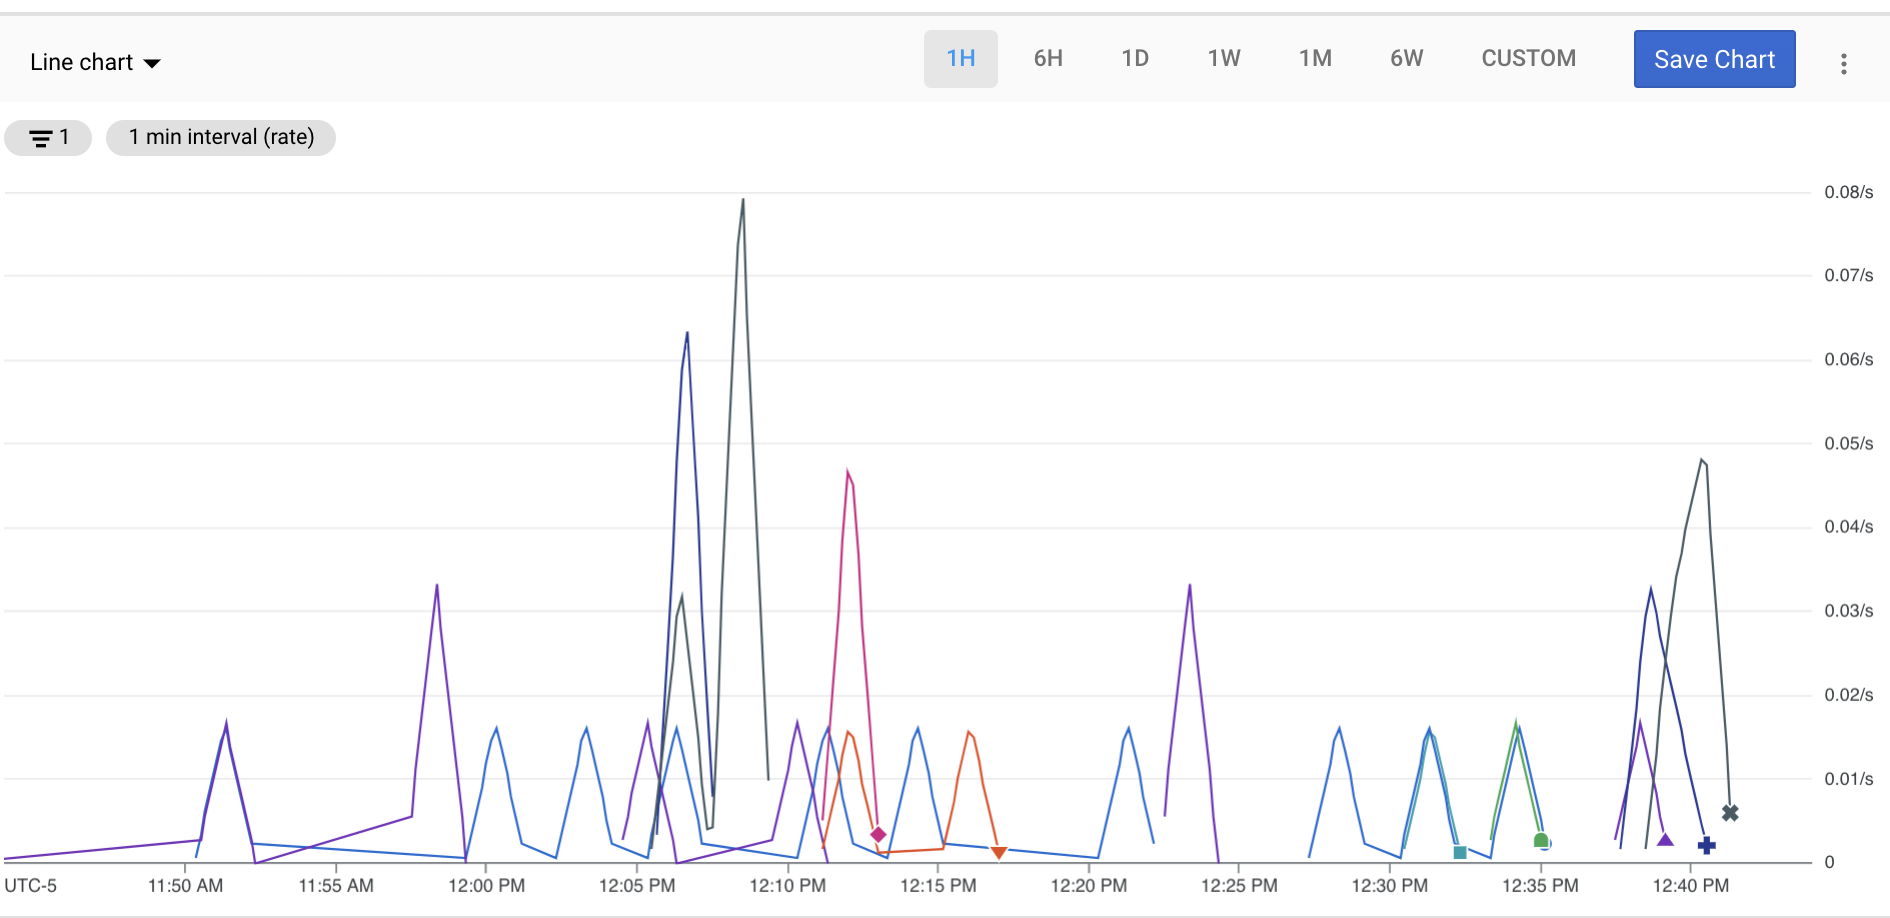
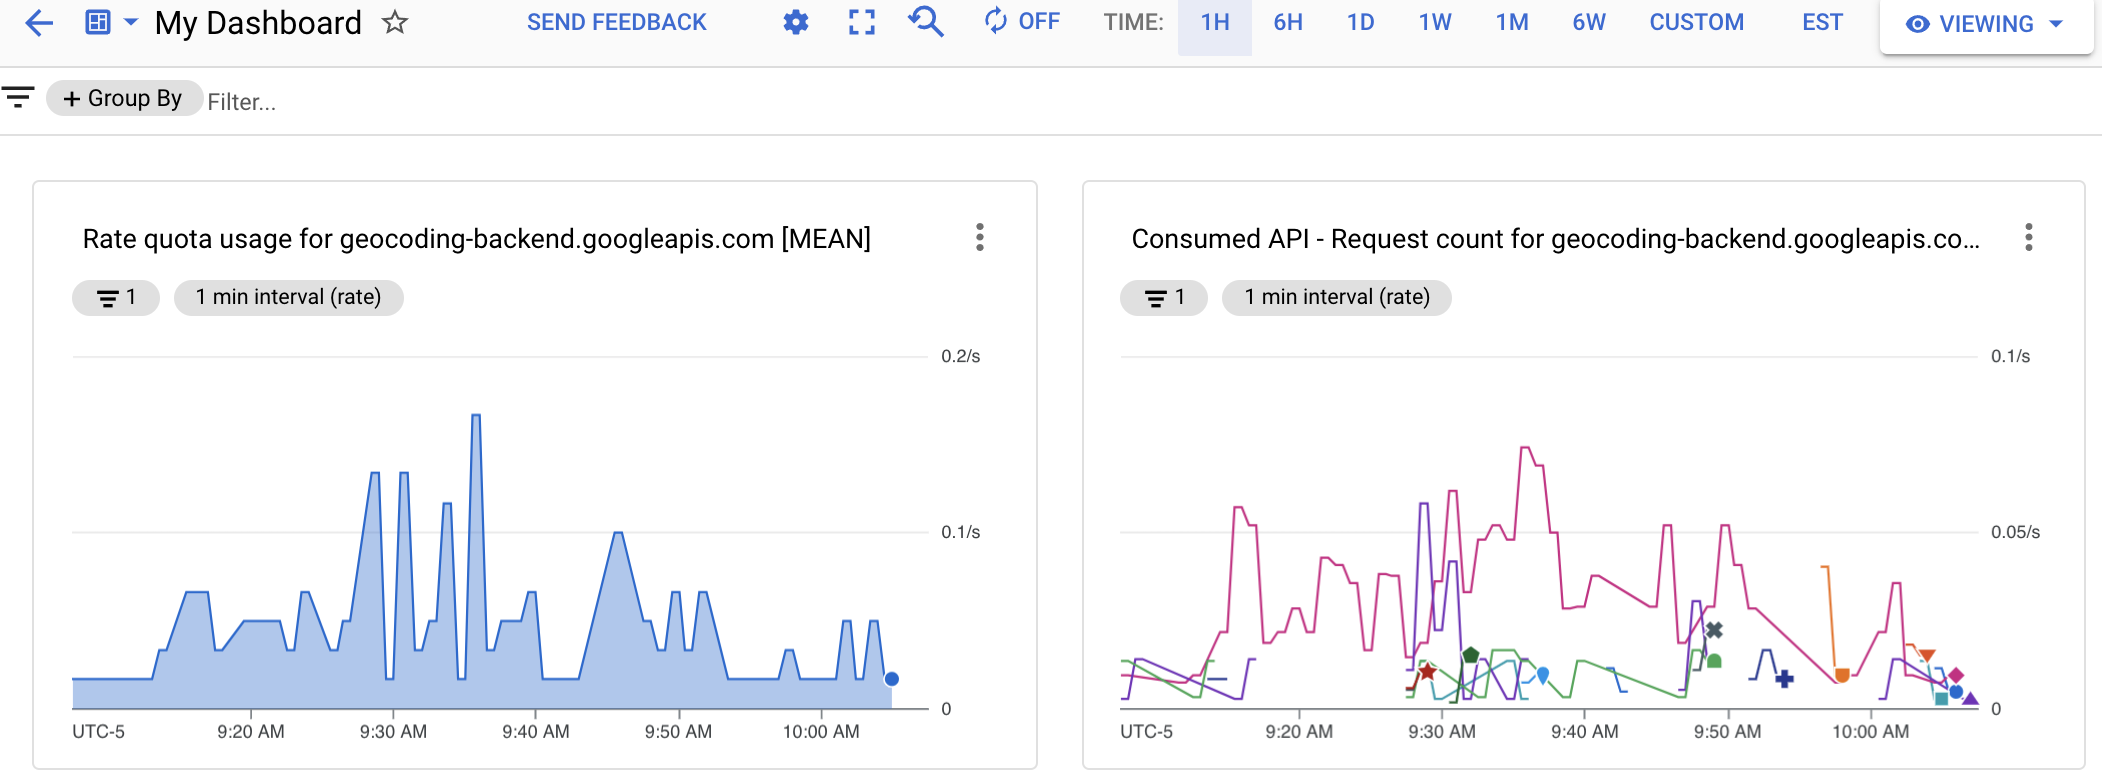
信息中心
信息中心可让您以一系列图表的形式查看和监控时序数据。如需创建自定义信息中心,您可以使用 Cloud 控制台或 Cloud Monitoring API。
下图显示了一个自定义信息中心,其中包含两个图表:左侧是配额图表,右侧是 API 计数图表。
提醒
如需在服务表现不符合您设定的标准时接收通知,请创建提醒政策。例如,您可以创建一条提醒政策,在服务返回的 HTTP 200 响应延迟时间第 90 百分位超过 100 毫秒时,让系统通知您的待命团队。
借助提醒,您可以及时了解您的云应用中出现的问题,以便迅速解决问题。
Cloud Monitoring 支持许多类型的提醒,例如: