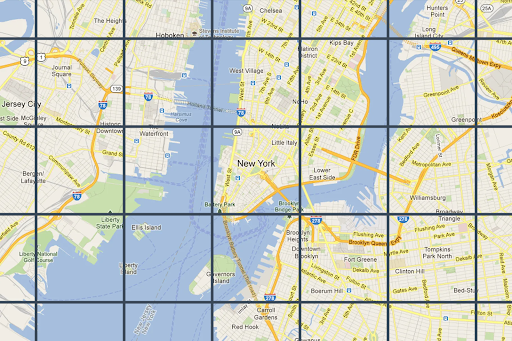
نظرة عامة على "المربّعات الثنائية الأبعاد"
تنظيم صفحاتك في مجموعات
يمكنك حفظ المحتوى وتصنيفه حسب إعداداتك المفضّلة.
المطوّرون في المنطقة الاقتصادية الأوروبية
إنّ مربّعات الخرائط هي ببساطة تقسيم العالم إلى شبكة مفهرسة. تتيح لك هذه الخدمة الوصول إلى بيانات الخرائط واستخدامها بكفاءة وديناميكية
بمقاييس خرائطية متعددة. تتيح لك Map Tiles API الوصول إلى
مجموعات بيانات جغرافية موضوعية متعدّدة، بما في ذلك تلك التي تشرف عليها Google:
مربّعات صور خريطة الطريق استنادًا إلى بيانات طبوغرافية متجهة مع تصميمات خرائطية من Google
صور Orthophotography ملتقَطة بواسطة كاميرات الأقمار الصناعية والكاميرات المحمولة جوًا، وتوفّر صورًا من الأعلى (نقطة السمت) للأرض.
خرائط خطوط الظل
تكون جميع مربّعات الخرائط الثنائية الأبعاد مرتبطة جغرافيًا ومحاذية لبعضها البعض. ويتم اختيارها
استنادًا إلى النطاق الجغرافي لإطار العرض ومستوى التكبير. تتراوح مستويات التكبير/التصغير بين صفر (لعرض العالم بأكمله) و22 (لعرض الشوارع والمربّعات السكنية).
مواضيع الخرائط
يمكنك الحصول على مربّعات الخرائط لمواضيع الخرائط التالية.
مظهر الخريطة
الوصف
خارطة الطريق
الطرق والمباني والأماكن المهمة والحدود السياسية
القمر الصناعي
صور فوتوغرافية مأخوذة من الفضاء
التضاريس
خريطة كنتورية تعرض ميزات طبيعية مثل النباتات
ملاحظة: يمكن أن تتألف مربّعات الخرائط من طبقة واحدة أو أكثر. على سبيل المثال، يمكن عرض طبقة لخريطة الطريق فوق موضوع خريطة القمر الصناعي. لمزيد من المعلومات، يُرجى الاطّلاع على الحقول الاختيارية .
لطلب مربّعات الخرائط من Map Tiles API، عليك أولاً طلب رمز مميّز للجلسة . يتتبّع رمز الجلسة الحالة الحالية للخريطة ونافذة العرض. عند إعداد رمز الجلسة، يجب ضبط قيمة mapType
لتتطابق مع مظهر الخريطة الذي تريده.
بعد ذلك، يجب تضمين رمز الجلسة المميّز في كل طلب ترسله إلى Map Tiles API.
طلبات الحصول على معلومات إطار العرض
يحدّد إطار العرض حجم المربّع الذي يحيط بمشهد العالم. تعرض طلبات معلومات إطار العرض تفاصيل حول مربّعات الخريطة التي تشكّل إطار العرض الحالي. السبب الذي يجعلك تطلب معلومات عن إطار العرض هو التأكّد من أنّك تتجنّب طلب صور بمستويات تكبير غير متوفّرة.
على سبيل المثال، تتوفّر في معظم المدن صور بمستوى التكبير 22، ولكن لا تتوفّر في المحيط لأنّها ستعرض مربعات زرقاء بدون أي معالم.
ملاحظة: يتضمّن الرد معلومات تحديد المصدر التي يجب عرضها مع الخريطة، ومستوى التكبير/التصغير الأقصى، ما يتيح لك إنشاء شريط تمرير للتكبير/التصغير. لمزيد من المعلومات، يُرجى الاطّلاع على سياسات Map Tiles API .
طلب إطار العرض هو طلب GET باستخدام HTTPS بالشكل التالي.
curl "https://tile.googleapis.com/tile/v1/viewport ?session=YOUR_SESSION_TOKEN &key=YOUR_API_KEY &zoom=zoom &north=north &south=south &east=east &west=west "
يحتوي الطلب على الحقول التالية:
zoom
مستوى التكبير أو التصغير لإطار العرض.
north
، وsouth
، وeast
، وwest
تمثّل هذه السمة أبعد النقاط شمالاً وجنوبًا وشرقًا وغربًا في إطار العرض، ويتم التعبير عنها بالدرجات. يجب أن يكون الشمال والجنوب ضمن النطاق (-90,90)، ويجب أن يكون الشرق والغرب ضمن النطاق (-180, 180). للتعبير عن حدود تعبر خط الزوال المعاكس، يمكن أن تكون قيمة الغرب موجبة (على سبيل المثال، 170) وقيمة الشرق سالبة (على سبيل المثال، -170). جميع المَعلمات مطلوبة.
ردود معلومات إطار العرض
يخبرك ردّ إطار العرض بالمناطق التي تتضمّن صورًا ومستويات التكبير/التصغير. تتّخذ استجابة معلومات إطار العرض الشكل التالي.
{
"copyright" : "Map data ©2023" ,
"maxZoomRects" : [
{
"maxZoom" : 19 ,
"north" : 90 ,
"south" : -90 ,
"east" : 180 ,
"west" : -180
},
{
"maxZoom" : 9 ,
"north" : 90 ,
"south" : -90 ,
"east" : 180 ,
"west" : -180
},
{
"maxZoom" : 14 ,
"north" : 84.375 ,
"south" : -84.375 ,
"east" : 180 ,
"west" : -180
}, ...
]
}
ملاحظة: في هذا المثال، تحتوي مصفوفة maxZoomRects
على عناصر أكثر مما هو معروض.
يحتوي نص الاستجابة على الحقول التالية.
copyright
يحتوي على سلسلة مصدر يجب عرضها على خريطتك عند عرض مربّعات الخريطة التفصيلية ومربّعات صور الأقمار الصناعية. لمزيد من المعلومات، يُرجى الاطّلاع على
سياسات Map Tiles API .
maxZoomRect
يحتوي على صفيف من المستطيلات المحيطة التي تتداخل مع إطار العرض الحالي. يحتوي أيضًا على الحد الأقصى لمستوى التكبير المتاح داخل كل مستطيل.
دوال إحداثيات المربّعات
تتوفّر أدوات (وظائف بسيطة) في معظم لغات البرمجة لتحويل أزواج خطوط الطول والعرض إلى إحداثيات المربّعات عند مستوى تكبير/تصغير معيّن.
إليك مثال على رمز JavaScript يحوّل أولاً من
latLng
إلى نقطة، ثم من نقطة إلى إحداثيات المربّعات.
var TILE_SIZE = 256 ;
function fromLatLngToPoint ( latLng ) {
var mercator = - Math . log ( Math . tan (( 0.25 + latLng . lat () / 360 ) * Math . PI ));
return {
x : TILE_SIZE * ( latLng . lng () / 360 + 0.5 ),
y : TILE_SIZE / 2 * ( 1 + mercator / Math . PI )
};
}
function fromLatLngToTileCoord ( latLng , zoom ) {
var point = fromLatLngToPoint ( latLng );
var scale = Math . pow ( 2 , zoom );
return {
x : Math . floor ( point . x * scale / TILE_SIZE ),
y : Math . floor ( point . y * scale / TILE_SIZE ),
z : zoom
};
}
إنّ محتوى هذه الصفحة مرخّص بموجب ترخيص Creative Commons Attribution 4.0 ما لم يُنصّ على خلاف ذلك، ونماذج الرموز مرخّصة بموجب ترخيص Apache 2.0 . للاطّلاع على التفاصيل، يُرجى مراجعة سياسات موقع Google Developers . إنّ Java هي علامة تجارية مسجَّلة لشركة Oracle و/أو شركائها التابعين.
تاريخ التعديل الأخير: 2025-08-29 (حسب التوقيت العالمي المتفَّق عليه)
[null,null,["تاريخ التعديل الأخير: 2025-08-29 (حسب التوقيت العالمي المتفَّق عليه)"],[[["\u003cp\u003eMap Tiles API allows access to various thematic geodatasets like roadmap, orthophotography, and hillshade, dividing the world into an indexed grid for efficient data utilization.\u003c/p\u003e\n"],["\u003cp\u003eMap tiles are available in roadmap, satellite, and terrain themes, and can be overlaid for richer visualizations.\u003c/p\u003e\n"],["\u003cp\u003eA session token is required for accessing Map Tiles API, which tracks the map state and desired theme.\u003c/p\u003e\n"],["\u003cp\u003eViewport information requests help determine available zoom levels and imagery for a specific area to avoid requesting non-existent data.\u003c/p\u003e\n"],["\u003cp\u003eTile coordinate functions can be used to convert latitude/longitude pairs into tile coordinates for specific zoom levels, enabling precise map tile retrieval.\u003c/p\u003e\n"]]],["Map Tiles API provides access to geodatasets, including roadmap, satellite, and terrain themes, divided into an indexed grid. Users request a session token and specify a map theme. Viewport information, obtained via HTTPS GET requests, determines the available imagery and zoom levels (0-22) within a defined area. Responses include copyright attribution and maximum zoom levels. Tile coordinate functions convert latitude/longitude to tile coordinates for specific zoom levels.\n"],null,["# 2D Tiles overview\n\n**European Economic Area (EEA) developers** If your billing address is in the European Economic Area, effective on 8 July 2025, the [Google\n| Maps Platform EEA Terms of Service](https://cloud.google.com/terms/maps-platform/eea) will apply to your use of the Services. [Learn more](/maps/comms/eea/faq). In addition, certain content from the Map Tiles API will no longer be returned. [Learn more](/maps/comms/eea/map-tiles).\n\nMap Tiles are simply the division of the world into an indexed\ngrid. It lets you access and utilize map data efficiently and dynamically\nat multiple cartographic scales. Map Tiles API gives you access to\nmultiple thematic geodatasets, including Google-curated:\n\n- Roadmap image tiles based on vector topographic data with Google's\n cartographic styling.\n\n- Orthophotography captured by both satellite and airborne cameras that deliver\n top down (nadir) imagery of the earth.\n\n- Hillshade contour maps.\n\n2D Map Tiles are all georeferenced and aligned to each other. They're selected\nbased on the geographic extent of the viewport and the zoom level. Zoom levels\nrange from zero (to view the world in its entirety) to 22 (to view streets and\nblocks).\n\nMap themes\n----------\n\nYou can get map tiles for the following map themes.\n\n| Map theme | Description |\n|-------------------------------------------------|----------------------------------------------------------------|\n| [Roadmap](/maps/documentation/tile/roadmap) | Roads, buildings, points of interest, and political boundaries |\n| [Satellite](/maps/documentation/tile/satellite) | Photographic imagery taken from space |\n| [Terrain](/maps/documentation/tile/terrain) | A contour map that shows natural features such as vegetation |\n\n| **Note:** Map tiles can consist of one or more layers. For example, a roadmap layer can be overlaid on top of a satellite map theme. For more information, see [Optional fields](/maps/documentation/tile/session_tokens#optional_fields).\n\nTo request map tiles from Map Tiles API, you must first request a\n[session token](/maps/documentation/tile/session_tokens). The session token\ntracks the current state of your map and viewport. When you set up your session\ntoken, you must set the `mapType` value to match the map theme that you want.\nThen, you must include the session token in each of your requests to\nMap Tiles API.\n\nViewport information requests\n-----------------------------\n\nThe viewport defines the size of the box that frames the world scene. Viewport\ninformation requests return details about the map tiles that make up your\ncurrent viewport. The reason that you request viewport information is to ensure\nthat you avoid requesting imagery at zoom levels that don't exist.\n\nFor example, most cities have imagery at zoom level 22, but not the ocean since\nit would just end up displaying featureless blue squares.\n| **Note:** Included in the response is the attribution that you must display with your map, and the maximum zoom level---so you can build a zoom slider. For more information, see the [Map Tiles API Policies](/maps/documentation/tile/policies#map-tiles-api).\n\nThe viewport request is an HTTPS GET request in the following form. \n\n```json\ncurl \"https://tile.googleapis.com/tile/v1/viewport?session=\u003cvar class=\"apiparam\" translate=\"no\"\u003eYOUR_SESSION_TOKEN\u003c/var\u003e&key=YOUR_API_KEY&zoom=\u003cvar class=\"apiparam\" translate=\"no\"\u003ezoom\u003c/var\u003e&north=\u003cvar class=\"apiparam\" translate=\"no\"\u003enorth\u003c/var\u003e&south=\u003cvar class=\"apiparam\" translate=\"no\"\u003esouth\u003c/var\u003e&east=\u003cvar class=\"apiparam\" translate=\"no\"\u003eeast\u003c/var\u003e&west=\u003cvar class=\"apiparam\" translate=\"no\"\u003ewest\u003c/var\u003e\"\n```\n\nThe request contains the following fields:\n\n`zoom`\n: The zoom level of the viewport.\n\n`north`, `south`, `east`, `west`\n: The furthest north, south, east, and west points in the viewport, expressed in\n degrees. North and south must be in the range (-90,90), east and west must be in\n the range (-180, 180). To express bounds crossing the antimeridian, west can be\n positive (for example, 170) and east can be negative (for example, -170). All\n parameters are required.\n\nViewport information responses\n------------------------------\n\nThe viewport response tells you which areas have imagery, and at which zoom\nlevels. A viewport information response has the following form. \n\n {\n \"copyright\": \"Map data ©2023\",\n \"maxZoomRects\": [\n {\n \"maxZoom\": 19,\n \"north\": 90,\n \"south\": -90,\n \"east\": 180,\n \"west\": -180\n },\n {\n \"maxZoom\": 9,\n \"north\": 90,\n \"south\": -90,\n \"east\": 180,\n \"west\": -180\n },\n {\n \"maxZoom\": 14,\n \"north\": 84.375,\n \"south\": -84.375,\n \"east\": 180,\n \"west\": -180\n }, ...\n ]\n }\n\n| **Note:** In this example, the `maxZoomRects` array contains more objects than is shown.\n\nThe response body contains the following fields.\n\n`copyright`\n: Contains an attribution string that you must display on your map when you\n display roadmap and satellite tiles. For more information, see the\n [Map Tiles API Policies](/maps/documentation/tile/policies#map-tiles-api).\n\n`maxZoomRect`\n: Contains an array of bounding rectangles that overlap with the current\n viewport. Also contains the maximum zoom level available within each rectangle.\n\nTile coordinate functions\n-------------------------\n\nTools (simple functions) are available in most programming languages to convert\nfrom latitude/longitude pairs to tile coordinates at a specific zoom level.\nConsider the following JavaScript code example that first converts from a\n`latLng` to a point, and then from a point to tile coordinates. \n\n var TILE_SIZE = 256;\n\n function fromLatLngToPoint(latLng) {\n var mercator = -Math.log(Math.tan((0.25 + latLng.lat() / 360) * Math.PI));\n return {\n x: TILE_SIZE * (latLng.lng() / 360 + 0.5),\n y: TILE_SIZE / 2 * (1 + mercator / Math.PI)\n };\n }\n\n function fromLatLngToTileCoord(latLng, zoom) {\n var point = fromLatLngToPoint(latLng);\n var scale = Math.pow(2, zoom);\n\n return {\n x: Math.floor(point.x * scale / TILE_SIZE),\n y: Math.floor(point.y * scale / TILE_SIZE),\n z: zoom\n };\n }"]]