 地図タイルは、世界をインデックス付きのグリッドに分割したものです。これにより、複数の地図縮尺で地図データに効率的かつ動的にアクセスして利用できます。Map Tiles API を使用すると、Google がキュレートしたデータを含む、複数のテーマ別地理データセットにアクセスできます。
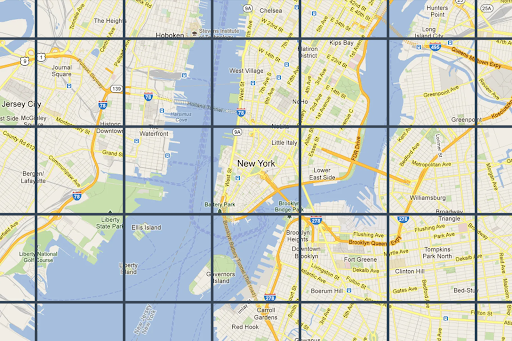
Google の地図作成スタイルを使用した、ベクトル地形データに基づくロードマップ画像タイル。
衛星カメラと航空機搭載カメラの両方で撮影されたオルソフォト。地球の真上(天底)の画像を提供します。
陰影起伏図。
2D 地図タイルはすべてジオリファレンスされ、互いに位置合わせされています。ビューポートの地理的範囲とズームレベルに基づいて選択されます。ズームレベルは 0(世界全体を表示)から 22(通りやブロックを表示)までです。
地図のテーマ
次の地図テーマの地図タイルを取得できます。
| 地図のテーマ | 説明 |
|---|---|
| ロードマップ | 道路、建物、スポット、行政境界 |
| 衛星 | 宇宙から撮影された写真画像 |
| 地形 | 植生などの自然特性を示す等高線地図 |
Map Tiles API から地図タイルをリクエストするには、まずセッション トークンをリクエストする必要があります。セッション トークンは、地図とビューポートの現在の状態を追跡します。セッション トークンを設定するときは、必要な地図のテーマに合わせて mapType の値を設定する必要があります。その後、Map Tiles API への各リクエストにセッション トークンを含める必要があります。
ビューポートに関する情報のリクエスト
ビューポートは、ワールド シーンを囲むボックスのサイズを定義します。ビューポート情報リクエストは、現在のビューポートを構成する地図タイルの詳細を返します。ビューポート情報をリクエストする理由は、存在しないズームレベルで画像がリクエストされないようにするためです。
たとえば、ほとんどの都市ではズームレベル 22 の画像がありますが、海は特徴のない青い正方形が表示されるだけなので、画像はありません。
ビューポート リクエストは、次の形式の HTTPS GET リクエストです。
curl "https://tile.googleapis.com/tile/v1/viewport?session=YOUR_SESSION_TOKEN &key=YOUR_API_KEY &zoom=zoom &north=north &south=south &east=east &west=west"
リクエストには次のフィールドが含まれます。
zoom- ビューポートのズームレベル。
north、south、east、west- ビューポートの最北端、最南端、最東端、最西端のポイントを度で表します。北と南は (-90, 90) の範囲、東と西は (-180, 180) の範囲で指定する必要があります。子午線を越える境界を表すには、西を正の値(170 など)、東を負の値(-170 など)にすることができます。すべてのパラメータが必須です。
ビューポート情報レスポンス
ビューポート レスポンスは、どのエリアに画像があるか、どのズームレベルで画像があるかを示します。ビューポート情報レスポンスの形式は次のとおりです。
{
  "copyright": "Map data ©2023",
  "maxZoomRects": [
    {
      "maxZoom": 19,
      "north": 90,
      "south": -90,
      "east": 180,
      "west": -180
    },
    {
      "maxZoom": 9,
      "north": 90,
      "south": -90,
      "east": 180,
      "west": -180
    },
    {
      "maxZoom": 14,
      "north": 84.375,
      "south": -84.375,
      "east": 180,
      "west": -180
    }, ...
  ]
}
レスポンス本文には次のフィールドが含まれます。
copyright- には、ロードマップ タイルと衛星タイルを表示するときに地図上に表示する必要がある帰属情報文字列が含まれます。詳細については、Map Tiles API のポリシーをご覧ください。
maxZoomRect- 現在のビューポートと重なる境界矩形の配列が含まれます。各長方形内で使用可能な最大ズームレベルも含まれます。
タイル座標関数
ほとんどのプログラミング言語で、緯度と経度のペアから特定のズームレベルのタイル座標に変換するツール(単純な関数)を利用できます。次の JavaScript コード例では、最初に latLng からポイントに変換し、次にポイントからタイル座標に変換します。
var TILE_SIZE = 256;

function fromLatLngToPoint(latLng) {
  var mercator = -Math.log(Math.tan((0.25 + latLng.lat() / 360) * Math.PI));
  return {
    x: TILE_SIZE * (latLng.lng() / 360 + 0.5),
    y: TILE_SIZE / 2 * (1 +  mercator / Math.PI)
  };
}

function fromLatLngToTileCoord(latLng, zoom) {
  var point = fromLatLngToPoint(latLng);
  var scale = Math.pow(2, zoom);

  return {
    x: Math.floor(point.x * scale / TILE_SIZE),
    y: Math.floor(point.y * scale / TILE_SIZE),
    z: zoom
  };
}