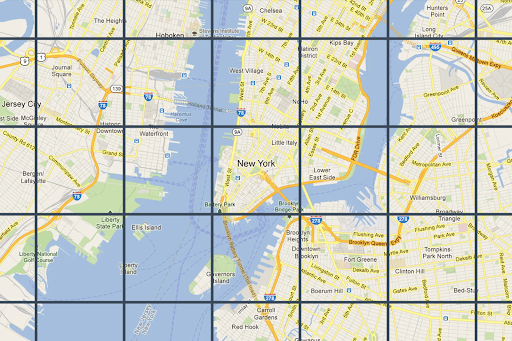
2D 图块概览
使用集合让一切井井有条
根据您的偏好保存内容并对其进行分类。
地图块只是将世界划分为一个带索引的网格。借助该 API,您可以在多个制图比例下高效且动态地访问和利用地图数据。Map Tiles API 可让您访问多个主题地理数据集,包括 Google 精心挑选的以下数据集:
所有 2D 地图图块都经过地理参考处理,并且彼此对齐。它们是根据视口的地理范围和缩放级别选择的。缩放级别的范围为 0(查看整个世界)到 22(查看街道和街区)。
地图主题
您可以获取以下地图主题的地图图块。
地图主题 |
说明 |
路线图 |
道路、建筑物、地图注点和政治边界 |
卫星 |
从太空拍摄的摄影图像 |
地形 |
显示植被等自然地貌的等高线地图 |
如需从 Map Tiles API 请求地图图块,您必须先请求会话令牌。会话令牌用于跟踪地图和视口的当前状态。设置会话令牌时,您必须将 mapType
值设置为与所需地图主题相匹配的值。然后,您必须在向 Map Tiles API 发送的每个请求中都添加会话令牌。
视口信息请求
视口定义了框定世界场景的框的大小。视口信息请求会返回有关构成当前视口的地图块的详细信息。您之所以请求视口信息,是为了确保您不会请求不存在的缩放级别的图像。
例如,大多数城市都有 22 级缩放级别的图像,但海洋没有,因为海洋只会显示没有特征的蓝色方块。
视口请求是采用以下形式的 HTTPS GET 请求。
curl "https://tile.googleapis.com/tile/v1/viewport?session=YOUR_SESSION_TOKEN&key=YOUR_API_KEY&zoom=zoom&north=north&south=south&east=east&west=west"
该请求包含以下字段:
zoom
- 视口的缩放级别。
north
、south
、east
、west
- 视口中最北、最南、最东和最西的点(以度为单位)。南北必须在 (-90,90) 范围内,东西必须在 (-180, 180) 范围内。若要表示跨越反子午线的边界,西侧可以是正值(例如 170),东侧可以是负值(例如 -170)。所有参数均必填。
视口信息响应
视口响应会告知您哪些区域有图像,以及在哪些缩放级别有图像。视口信息响应采用以下形式。
{
"copyright": "Map data ©2023",
"maxZoomRects": [
{
"maxZoom": 19,
"north": 90,
"south": -90,
"east": 180,
"west": -180
},
{
"maxZoom": 9,
"north": 90,
"south": -90,
"east": 180,
"west": -180
},
{
"maxZoom": 14,
"north": 84.375,
"south": -84.375,
"east": 180,
"west": -180
}, ...
]
}
响应正文包含以下字段。
copyright
- 包含一个提供方说明字符串,您在显示路线图和卫星图块时必须在地图上显示该字符串。如需了解详情,请参阅 Map Tiles API 政策。
maxZoomRect
- 包含与当前视口重叠的边界矩形数组。还包含每个矩形内的最大可用缩放级别。
图块坐标函数
大多数编程语言都提供了工具(简单函数),用于将纬度/经度对转换为特定缩放级别的图块坐标。请看以下 JavaScript 代码示例,该示例首先将 latLng
转换为点,然后将点转换为图块坐标。
var TILE_SIZE = 256;
function fromLatLngToPoint(latLng) {
var mercator = -Math.log(Math.tan((0.25 + latLng.lat() / 360) * Math.PI));
return {
x: TILE_SIZE * (latLng.lng() / 360 + 0.5),
y: TILE_SIZE / 2 * (1 + mercator / Math.PI)
};
}
function fromLatLngToTileCoord(latLng, zoom) {
var point = fromLatLngToPoint(latLng);
var scale = Math.pow(2, zoom);
return {
x: Math.floor(point.x * scale / TILE_SIZE),
y: Math.floor(point.y * scale / TILE_SIZE),
z: zoom
};
}
如未另行说明,那么本页面中的内容已根据知识共享署名 4.0 许可获得了许可,并且代码示例已根据 Apache 2.0 许可获得了许可。有关详情,请参阅 Google 开发者网站政策。Java 是 Oracle 和/或其关联公司的注册商标。
最后更新时间 (UTC):2025-08-29。
[null,null,["最后更新时间 (UTC):2025-08-29。"],[[["\u003cp\u003eMap Tiles API allows access to various thematic geodatasets like roadmap, orthophotography, and hillshade, dividing the world into an indexed grid for efficient data utilization.\u003c/p\u003e\n"],["\u003cp\u003eMap tiles are available in roadmap, satellite, and terrain themes, and can be overlaid for richer visualizations.\u003c/p\u003e\n"],["\u003cp\u003eA session token is required for accessing Map Tiles API, which tracks the map state and desired theme.\u003c/p\u003e\n"],["\u003cp\u003eViewport information requests help determine available zoom levels and imagery for a specific area to avoid requesting non-existent data.\u003c/p\u003e\n"],["\u003cp\u003eTile coordinate functions can be used to convert latitude/longitude pairs into tile coordinates for specific zoom levels, enabling precise map tile retrieval.\u003c/p\u003e\n"]]],["Map Tiles API provides access to geodatasets, including roadmap, satellite, and terrain themes, divided into an indexed grid. Users request a session token and specify a map theme. Viewport information, obtained via HTTPS GET requests, determines the available imagery and zoom levels (0-22) within a defined area. Responses include copyright attribution and maximum zoom levels. Tile coordinate functions convert latitude/longitude to tile coordinates for specific zoom levels.\n"],null,["# 2D Tiles overview\n\n**European Economic Area (EEA) developers** If your billing address is in the European Economic Area, effective on 8 July 2025, the [Google\n| Maps Platform EEA Terms of Service](https://cloud.google.com/terms/maps-platform/eea) will apply to your use of the Services. [Learn more](/maps/comms/eea/faq). In addition, certain content from the Map Tiles API will no longer be returned. [Learn more](/maps/comms/eea/map-tiles).\n\nMap Tiles are simply the division of the world into an indexed\ngrid. It lets you access and utilize map data efficiently and dynamically\nat multiple cartographic scales. Map Tiles API gives you access to\nmultiple thematic geodatasets, including Google-curated:\n\n- Roadmap image tiles based on vector topographic data with Google's\n cartographic styling.\n\n- Orthophotography captured by both satellite and airborne cameras that deliver\n top down (nadir) imagery of the earth.\n\n- Hillshade contour maps.\n\n2D Map Tiles are all georeferenced and aligned to each other. They're selected\nbased on the geographic extent of the viewport and the zoom level. Zoom levels\nrange from zero (to view the world in its entirety) to 22 (to view streets and\nblocks).\n\nMap themes\n----------\n\nYou can get map tiles for the following map themes.\n\n| Map theme | Description |\n|-------------------------------------------------|----------------------------------------------------------------|\n| [Roadmap](/maps/documentation/tile/roadmap) | Roads, buildings, points of interest, and political boundaries |\n| [Satellite](/maps/documentation/tile/satellite) | Photographic imagery taken from space |\n| [Terrain](/maps/documentation/tile/terrain) | A contour map that shows natural features such as vegetation |\n\n| **Note:** Map tiles can consist of one or more layers. For example, a roadmap layer can be overlaid on top of a satellite map theme. For more information, see [Optional fields](/maps/documentation/tile/session_tokens#optional_fields).\n\nTo request map tiles from Map Tiles API, you must first request a\n[session token](/maps/documentation/tile/session_tokens). The session token\ntracks the current state of your map and viewport. When you set up your session\ntoken, you must set the `mapType` value to match the map theme that you want.\nThen, you must include the session token in each of your requests to\nMap Tiles API.\n\nViewport information requests\n-----------------------------\n\nThe viewport defines the size of the box that frames the world scene. Viewport\ninformation requests return details about the map tiles that make up your\ncurrent viewport. The reason that you request viewport information is to ensure\nthat you avoid requesting imagery at zoom levels that don't exist.\n\nFor example, most cities have imagery at zoom level 22, but not the ocean since\nit would just end up displaying featureless blue squares.\n| **Note:** Included in the response is the attribution that you must display with your map, and the maximum zoom level---so you can build a zoom slider. For more information, see the [Map Tiles API Policies](/maps/documentation/tile/policies#map-tiles-api).\n\nThe viewport request is an HTTPS GET request in the following form. \n\n```json\ncurl \"https://tile.googleapis.com/tile/v1/viewport?session=\u003cvar class=\"apiparam\" translate=\"no\"\u003eYOUR_SESSION_TOKEN\u003c/var\u003e&key=YOUR_API_KEY&zoom=\u003cvar class=\"apiparam\" translate=\"no\"\u003ezoom\u003c/var\u003e&north=\u003cvar class=\"apiparam\" translate=\"no\"\u003enorth\u003c/var\u003e&south=\u003cvar class=\"apiparam\" translate=\"no\"\u003esouth\u003c/var\u003e&east=\u003cvar class=\"apiparam\" translate=\"no\"\u003eeast\u003c/var\u003e&west=\u003cvar class=\"apiparam\" translate=\"no\"\u003ewest\u003c/var\u003e\"\n```\n\nThe request contains the following fields:\n\n`zoom`\n: The zoom level of the viewport.\n\n`north`, `south`, `east`, `west`\n: The furthest north, south, east, and west points in the viewport, expressed in\n degrees. North and south must be in the range (-90,90), east and west must be in\n the range (-180, 180). To express bounds crossing the antimeridian, west can be\n positive (for example, 170) and east can be negative (for example, -170). All\n parameters are required.\n\nViewport information responses\n------------------------------\n\nThe viewport response tells you which areas have imagery, and at which zoom\nlevels. A viewport information response has the following form. \n\n {\n \"copyright\": \"Map data ©2023\",\n \"maxZoomRects\": [\n {\n \"maxZoom\": 19,\n \"north\": 90,\n \"south\": -90,\n \"east\": 180,\n \"west\": -180\n },\n {\n \"maxZoom\": 9,\n \"north\": 90,\n \"south\": -90,\n \"east\": 180,\n \"west\": -180\n },\n {\n \"maxZoom\": 14,\n \"north\": 84.375,\n \"south\": -84.375,\n \"east\": 180,\n \"west\": -180\n }, ...\n ]\n }\n\n| **Note:** In this example, the `maxZoomRects` array contains more objects than is shown.\n\nThe response body contains the following fields.\n\n`copyright`\n: Contains an attribution string that you must display on your map when you\n display roadmap and satellite tiles. For more information, see the\n [Map Tiles API Policies](/maps/documentation/tile/policies#map-tiles-api).\n\n`maxZoomRect`\n: Contains an array of bounding rectangles that overlap with the current\n viewport. Also contains the maximum zoom level available within each rectangle.\n\nTile coordinate functions\n-------------------------\n\nTools (simple functions) are available in most programming languages to convert\nfrom latitude/longitude pairs to tile coordinates at a specific zoom level.\nConsider the following JavaScript code example that first converts from a\n`latLng` to a point, and then from a point to tile coordinates. \n\n var TILE_SIZE = 256;\n\n function fromLatLngToPoint(latLng) {\n var mercator = -Math.log(Math.tan((0.25 + latLng.lat() / 360) * Math.PI));\n return {\n x: TILE_SIZE * (latLng.lng() / 360 + 0.5),\n y: TILE_SIZE / 2 * (1 + mercator / Math.PI)\n };\n }\n\n function fromLatLngToTileCoord(latLng, zoom) {\n var point = fromLatLngToPoint(latLng);\n var scale = Math.pow(2, zoom);\n\n return {\n x: Math.floor(point.x * scale / TILE_SIZE),\n y: Math.floor(point.y * scale / TILE_SIZE),\n z: zoom\n };\n }"]]