تنظيم صفحاتك في مجموعات
يمكنك حفظ المحتوى وتصنيفه حسب إعداداتك المفضّلة.
تحسين محركات البحث باستخدام رسم بياني فقاعي على Search Console
يُعدّ تحليل بيانات الأداء على "بحث Google" عملية صعبة، وتزداد صعوبة عندما يكون هناك العديد من
طلبات البحث الأقل تكرارًا أو استخدامًا والتي يصعب عرضها بشكل مرئي وفهمها. وبالتالي،
بإمكان الرسم البياني الفقاعي
مساعدتك في التعرّف على طلبات البحث التي تحقق أداءً جيدًا بالنسبة إلى موقعك الإلكتروني وتلك التي يمكن تحسين أدائها.
إذا أردت اختبار الأساليب الموضّحة هنا، يمكنك ربط بياناتك بـ Looker Studio وإجراء أي تعديلات تريدها على الإعدادات.
ننصحك بقراءة المحتوى الذي نوفره حول ربط خدمة Search Console بأداة Looker Studio
وتتبُّع عدد الزيارات الواردة من محرّك بحث Google باستخدام أداة Looker Studio
إذا لم يسبق لك قراءته، لأنّ ذلك يتيح لك معرفة المزيد حول الإجراءات التي يمكنك تنفيذها في Search Console باستخدام أداة Looker Studio.
فهم الرسم البياني
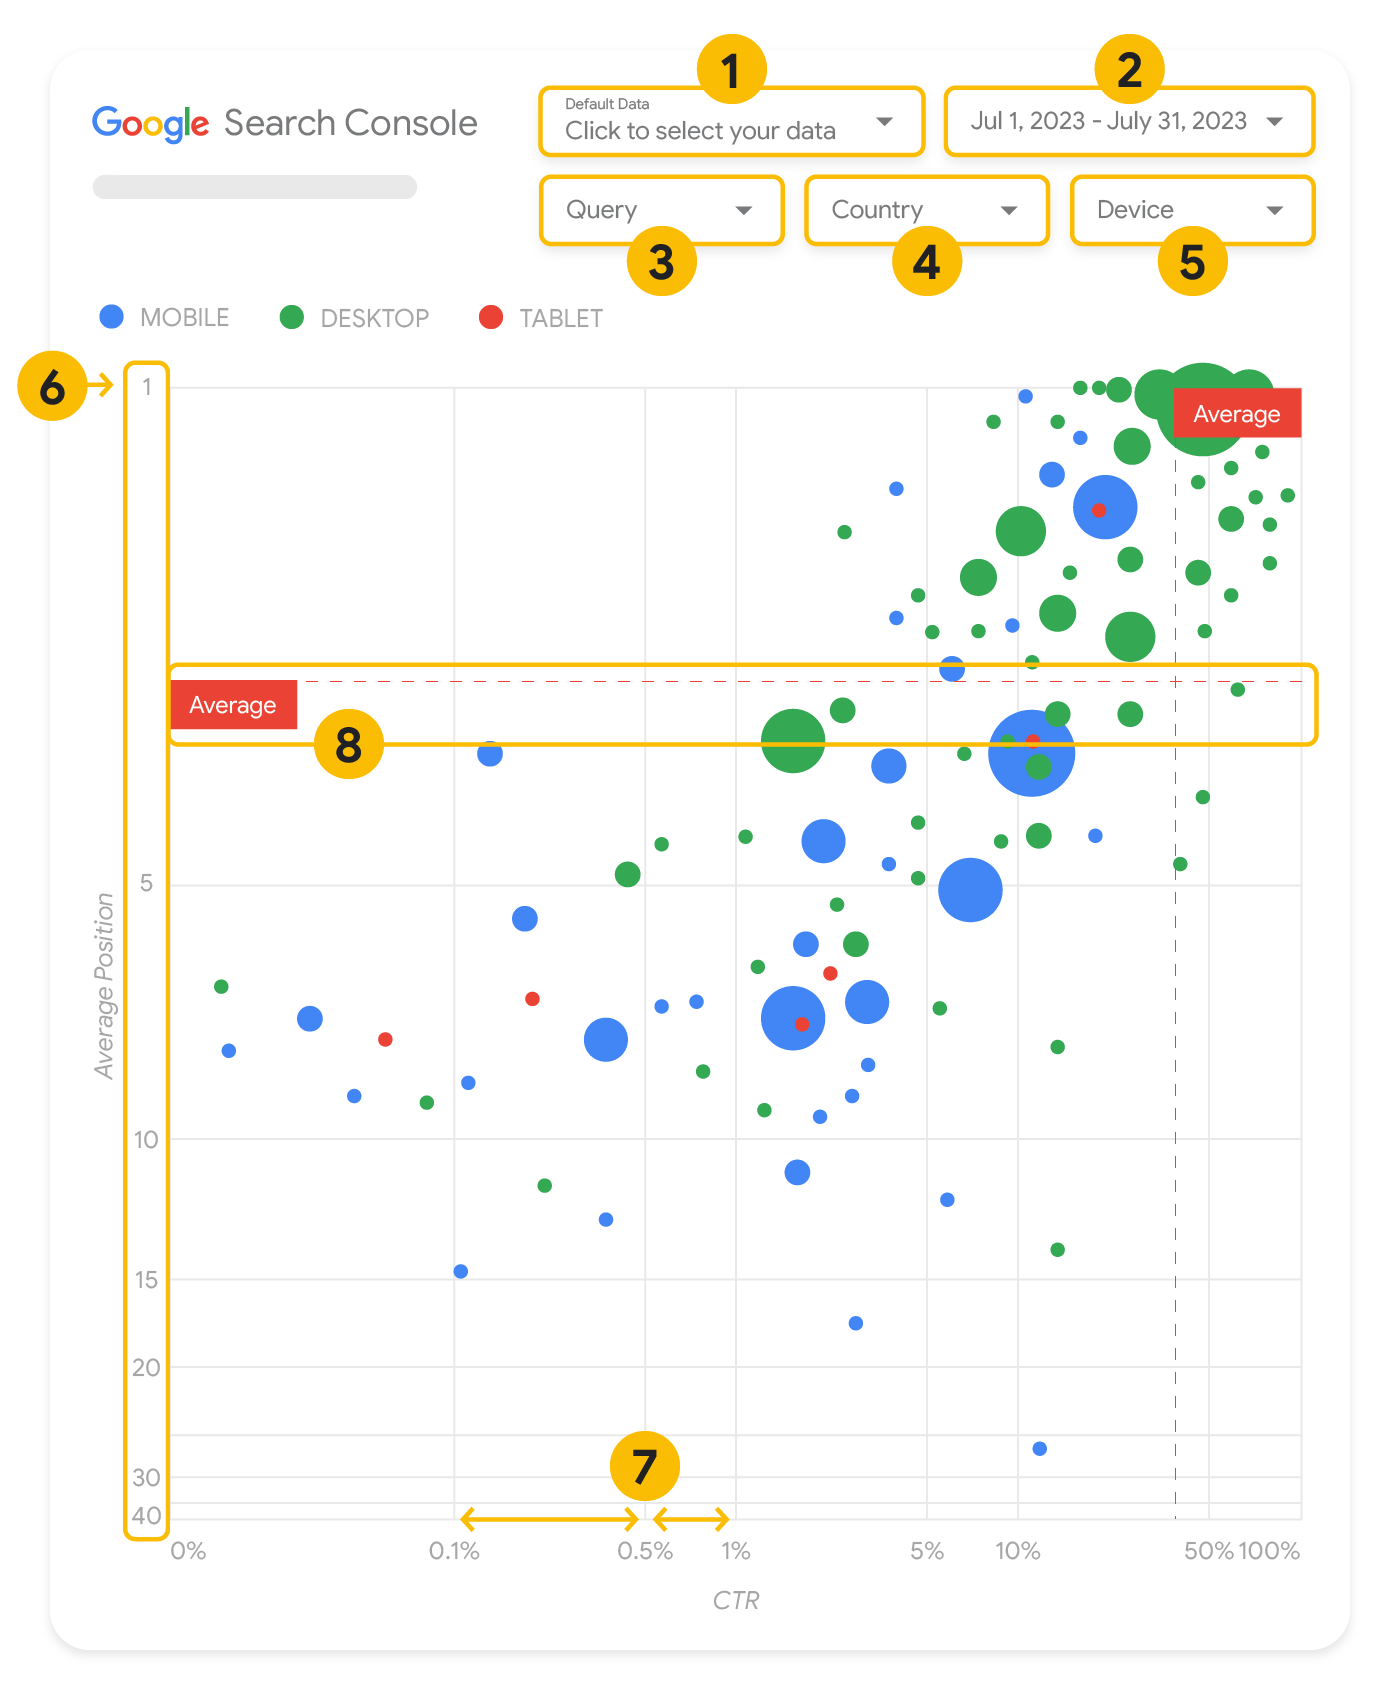
يشكّل الرسم البياني الفقاعي طريقة رائعة لعرض البيانات بشكل مرئي إذا كانت لديك عدة مقاييس وسمات، لأنّه
يتيح لك الاطّلاع على العلاقات والأنماط في
بياناتك على نحو أكثر فعالية. في المثال المعروض هنا، يمكنك رؤية
نسبة النقر إلى الظهور
(CTR) ومتوسط موضع الظهور وعدد النقرات الخاصة بِسمتَي طلب البحث والجهاز في الوقت نفسه.
تتناول هذه الفقرة بالتفصيل بعض عناصر الرسم البياني لتوضيح البيانات التي تظهر فيه وتلك التي لا تظهر.
مصدر البيانات
يستخدِم الرسم البياني الفقاعي المعروض في هذه الصفحة جدول "عدد مرات ظهور الموقع الإلكتروني" المتاح من خلال
مصدر البيانات في Search Console،
وهو يتضمن بيانات الأداء على "بحث Google"
التي تم تجميعها حسب الموقع الإلكتروني وطلبات البحث.
الفلاتر وعناصر التحكم في البيانات
تتوفر خمسة خيارات تخصيص في الرسم البياني لمساعدتك في التحكم بالبيانات بشكلٍ فعّال:
- التحكّم بالبيانات:
يتيح لك اختيار الموقع الإلكتروني على Search Console الذي تريد تحليل بياناته.
- النطاق الزمني: يتيح لك تحديد النطاق الزمني الذي تريد عرضه في التقرير. حسب الإعدادات التلقائية، يتم عرض
آخر 28 يومًا.
- طلب البحث: يتيح لك تضمين أو استبعاد طلبات بحث معيّنة بهدف التركيز عليها. يمكنك فلترة بياناتك
بشكل مشابه للطريقة التي تتّبعها في Search Console.
- البلد: يتيح لك تضمين بلدان محددة أو استبعادها.
- الجهاز: يتيح لك تضمين فئات أجهزة محددة أو استبعادها.
المحوران في الرسم البياني
يتضمن الرسم البياني محورَين، هما متوسط موضع الظهور (المحور الصادي) ونسبة النقر إلى الظهور الخاصة بالموقع الإلكتروني (المحور السيني). وقد أجرينا ثلاثة
تغييرات مهمة فيهما:
- الاتجاه العكسي للمحور الصادي: بما أنّ المحور الصادي يعرض متوسط موضع الظهور،
سيؤدي عكسه إلى أن يصبح الرقم 1 في الأعلى.
في معظم الرسومات البيانية، يكون الموضع الأفضل في الزاوية العليا اليمنى، لذا من الأسهل أن يتم عكس
المحور الصادي عند استخدامه لعرض متوسط موضع الظهور.
- المقياس اللوغاريتمي: يتيح لك استخدام المقياس اللوغاريتمي
على كِلا المحورَين إمكانية التعرّف بشكل أفضل على طلبات البحث الظاهرة في طرفَي
الرسم البياني (التي تكون فيها قيمة نسبة النقر إلى الظهور أو قيمة متوسط موضع الإعلان منخفضة جدًا أو تكون كلتا القيمتين منخفضتَين).
- الخطوط المرجعية:
يساعدك الخط المرجعي في إبراز القيم الواقعة فوق حدّ معيّن أو أدنى منه.
وعند الاطّلاع على المعدّل أو المتوسّط أو قيمة مئوية محددة، قد تظهر الانحرافات عن
النمط بشكل واضح.
الفقاعات التفسيرية
تمثّل كل فقاعة تفسيرية في الرسم البياني طلب بحث واحدًا يشمل
سمتَين للنمط:
- الحجم: إنّ استخدام عدد النقرات لتمثيل حجم الفقاعة التفسيرية يساعدك في الاطّلاع سريعًا على
طلبات البحث التي تحقق العدد الأكبر من الزيارات، إذ كلما كبر حجم الفقاعة،
ازداد عدد الزيارات الناتجة عن طلب البحث.
- اللون: إنّ استخدام فئة الجهاز لتمثيل لون الفقاعة التفسيرية يمكن أن يساعدك في معرفة الاختلافات
بين أداء الموقع الإلكتروني على "بحث Google" لكلّ من أجهزة الكمبيوتر المكتبي والأجهزة الجوّالة. يمكنك استخدام أي سمة لتمثيل اللون، ولكن عندما
يزداد عدد القيم، يصبح التعرّف على الأنماط أكثر صعوبة.
تحليل البيانات
الهدف من هذا التمثيل المرئي هو مساعدتك في التعرّف على أي فرص متاحة لتحسين أداء طلبات البحث. يعرض الرسم البياني
أداء طلبات البحث، حيث يمثّل المحور الصادي متوسط موضع الظهور ويمثّل المحور السيني نسبة النقر إلى الظهور،
في حين يمثّل حجم الفقاعة إجمالي عدد النقرات، ويمثّل لونها
فئة الجهاز.
يعرض الخطّان المرجعيان المتقطعان المرسومان باللون الأحمر (باسم Average) القيمة المتوسطة لكل محور، ويقسّمان الرسم البياني
إلى أربعة أقسام تعرض أربعة أنواع من الأداء الخاص بطلبات البحث. من المرجّح أن تبدو الأقسام الأربعة في الرسم البياني الخاص بك
بشكل مختلف عن الأقسام المعروضة في هذه المشاركة، إذ إنّها تستند إلى كيفية
توزيع طلبات البحث الخاصة بموقعك الإلكتروني.
يعرض الرسم البياني أربع مجموعات من طلبات البحث، ويمكنك تحليلها لتساعدك في تحديد الجانب الذي من المجدي تخصيص الوقت له
عند تحسين أداء موقعك الإلكتروني على "بحث Google".
- موضع مرتفع ونسبة نقر إلى ظهور مرتفعة: ما مِن حاجة إلى بذل الكثير من الجهد،
لأنّ الأداء جيّد.
- موضع منخفض ونسبة نقر إلى ظهور مرتفعة: يبدو أنّ طلبات البحث هذه ذات صلة باهتمامات المستخدمين، لأنّها تحصل على نسبة نقر إلى ظهور مرتفعة
حتى عندما يكون موضع الظهور أدنى
من متوسّط طلبات البحث على موقعك الإلكتروني. إذا ارتفع متوسط موضع الظهور الخاص بطلبات البحث هذه، قد يكون لذلك
تأثير مهم على أداء موقعك الإلكتروني، لذا ركِّز على تحسين محركات البحث استجابةً لطلبات البحث هذه. على سبيل المثال،
أحد طلبات البحث الأكثر رواجًا في القسم 2 من الرسم البياني بالنسبة إلى موقع إلكتروني مخصص للعناية بالحدائق هو "كيفية بناء كوخ خشبي".
تحقَّق ممّا إذا كان موقعك الإلكتروني يتضمّن صفحة تعرض معلومات ذات صلة بطلب البحث هذا، ثم تابِع العمل بإحدى هاتين الطريقتين:
- إذا لم تتوفّر لديك صفحة مماثلة، ننصحك بإنشاء صفحة تجمع في مكان مركزي كل المعلومات المتاحة على
موقعك الإلكتروني حول هذا الموضوع.
- إذا كان موقعك الإلكتروني يضم صفحة مماثلة، ننصحك بإضافة محتوى إليها بهدف تلبية احتياجات المستخدمين بشكل أفضل.
- موضع منخفض ونسبة نقر إلى ظهور منخفضة: عند عرض طلبات البحث التي لديها نسبة نقر إلى ظهور منخفضة (سواء كان موضع الظهور منخفضًا أو مرتفعًا)، من المهم ملاحظة حجم الفقاعات التفسيرية لمعرفة طلبات البحث
التي لديها نسبة نقر إلى ظهور منخفضة ولكنّها تجذب عددًا كبيرًا من الزيارات. قد يبدو أنّ طلبات البحث الظاهرة في هذا
القسم لا تستحق بذل أي مجهود لتحسينها، ولكن يمكن تقسيمها إلى مجموعتَين:
- طلبات البحث ذات الصلة: إذا كان طلب البحث المعني مهمًا بالنسبة إليك،
يمكنك اعتبار ظهوره في "بحث Google" إشارة جيدة للبدء. امنح أولوية أكبر لطلبات البحث هذه مقارنةً بطلبات البحث التي لا تظهر
في "بحث Google" إطلاقًا، لأنّه من الأسهل تحسين طلبات البحث الظاهرة.
- طلبات البحث غير المرتبطة بموقعك الإلكتروني: إذا لم يكُن موقعك الإلكتروني يعرض محتوى ذا صلة بطلب البحث هذا،
ننصحك بتحسين المحتوى الذي تعرضه والتركيز على طلبات البحث التي من شأنها جذب زيارات ذات صلة بذلك المحتوى.
- موضع مرتفع ونسبة نقر إلى الظهور منخفضة: قد تكون نسبة النقر إلى الظهور الخاصة بطلبات البحث هذه منخفضة لعدة أسباب. تحقَّق من
الفقاعات التفسيرية الأكبر حجمًا للعثور على إشارات ذات صلة بما يلي:
- قد يكون منافسوك يستخدمون ترميز البيانات المنظّمة
ويعرضون المحتوى ضمن النتائج الغنية بصريًا، ما قد يجذب المستخدمين إلى النقر على تلك النتائج
بدلاً من النتائج الذي يعرضها موقعك الإلكتروني. ننصحك بتحسين المحتوى الذي تعرضه ليتوافق مع
العناصر المرئية الأكثر شيوعًا في "بحث Google".
- قد تكون أجريت تحسينات أو حصلت على ترتيب عن طريق "الخطأ" لطلب بحث لا يهم المستخدمين
في ما يتعلّق بموقعك الإلكتروني. قد لا يكون في ذلك أي مشكلة بالنسبة إليك، وفي تلك الحالة، يمكنك تجاهل
طلبات البحث هذه. أما إذا كنت تفضّل ألّا يعثر عليك المستخدمون من خلال طلبات البحث هذه (لأنّها تتضمّن
كلمات مسيئة على سبيل المثال)، حاوِل إجراء تعديلات على المحتوى الخاص بك لإزالة أي عبارات قد يتم تصنيفها على أنّها
مرادفة لطلبات البحث التي تجذب هذه الزيارات أو ذات صلة بها.
- قد يكون المستخدمون سبق أن عثروا على المعلومات التي يحتاجون إليها، مثل ساعات العمل في شركتك أو عنوانها أو رقم الهاتف الخاص بها. اطّلِع على عبارات البحث التي تم استخدامها وعناوين URL التي تضمّنت
المعلومات المطلوبة. إذا كان أحد أهداف موقعك الإلكتروني هو جذب المستخدمين إلى متاجرك، يعني ذلك
أنّك على الطريق الصحيح. أما إذا كنت تفضّل أن ينتقل المستخدمون إلى موقعك الإلكتروني للحصول على مزيد من المعلومات،
فننصحك بالإشارة إلى ذلك بوضوح من خلال تحسين العناوين والأوصاف في موقعك. لمزيد من التفاصيل، انتقِل إلى الفقرة التالية.
لم نذكر فئات الأجهزة لأنّها قد تُستخدَم كإشارات إضافية بخصوص
أداء طلبات البحث. على سبيل المثال، قد تكون بعض طلبات البحث أكثر صلة بالمستخدمين
الذين يتنقلون في الشارع محاولين العثور على موقع جغرافي محدّد. وفي تلك الحالة، قد يكون أداء طلب البحث عاليًا
على الأجهزة الجوّالة ومنخفضًا على أجهزة الكمبيوتر المكتبي.
تحسين محركات البحث استجابةً لطلبات بحث محدّدة
بعد العثور على طلبات البحث التي تستحق بذل الوقت والمجهود، احرص على تحسين صفحاتك بما يتوافق معها
أو إنشاء صفحات ذات صلة بها.
بعد العثور على طلبات البحث المناسبة باستخدام العرض المرئي الظاهر في هذه الصفحة، يمكنك
إنشاء فلتر طلب بحث
خاص بطلبات بحث محدَّدة باستخدام واجهة المستخدم في Search Console، أو إنشاء
جدول محوري
باستخدام أداة Looker Studio، وتتيح لك كلتا الطريقتين الاطّلاع على جميع الصفحات التي تتلقّى
زيارات استجابةً لطلب بحث محدَّد. بعد تحديد طلبات البحث التي تريد تحسينها وعناوين URL ذات الصلة بها، استخدِم دليل تحسين نتائج محرّكات البحث للمبتدئين
بهدف تحسين المحتوى الذي تعرضه. إليك بعض النصائح:
- احرص على أن تكون عناصر العناوين
والعلامات الوصفية وسمات النص البديل وصفية ومحددة ودقيقة.
- استخدِم عناصر العناوين لتسليط الضوء على النص المهم والمساعدة في إنشاء بنية هرمية
للمحتوى، ما يسهّل على المستخدمين ومحرّكات البحث إمكانية التنقّل بين أقسام المستند.
- ننصحك بالتفكير في كلمات إضافية قد يبحث عنها المستخدم للعثور على محتوى معروض على موقعك الإلكتروني،
على سبيل المثال، المرادفات وطلبات البحث ذات الصلة بالمحتوى. يمكنك استخدام
أداة تخطيط الكلمات الرئيسية
المقدَّمة من "إعلانات Google" لمساعدتك في التعرّف على صيغ جديدة من الكلمات الرئيسية والاطّلاع على حجم البحث التقريبي لكل كلمة رئيسية. يمكنك أيضًا استخدام
مؤشرات Google للاطّلاع على أفكار جديدة
من خلال المواضيع والطلبات الرائجة ذات الصلة بموقعك الإلكتروني.
إنّ محتوى هذه الصفحة مرخّص بموجب ترخيص Creative Commons Attribution 4.0 ما لم يُنصّ على خلاف ذلك، ونماذج الرموز مرخّصة بموجب ترخيص Apache 2.0. للاطّلاع على التفاصيل، يُرجى مراجعة سياسات موقع Google Developers. إنّ Java هي علامة تجارية مسجَّلة لشركة Oracle و/أو شركائها التابعين.
تاريخ التعديل الأخير: 2025-08-04 (حسب التوقيت العالمي المتفَّق عليه)
[null,null,["تاريخ التعديل الأخير: 2025-08-04 (حسب التوقيت العالمي المتفَّق عليه)"],[[["\u003cp\u003eVisualize Search Console data with a bubble chart to reveal query optimization opportunities by analyzing click-through rate, average position, and clicks.\u003c/p\u003e\n"],["\u003cp\u003eIdentify high-potential queries by focusing on those with low positions but high click-through rates, indicating relevance and potential for increased traffic with improved ranking.\u003c/p\u003e\n"],["\u003cp\u003eInvestigate queries with low click-through rates and high positions to determine if they are unrelated to your site or require optimization for better user engagement.\u003c/p\u003e\n"],["\u003cp\u003eOptimize content for identified queries by refining titles, meta descriptions, headings, and incorporating relevant keywords to enhance search visibility and user experience.\u003c/p\u003e\n"]]],["A bubble chart visualizes query performance using Search Console data. It displays click-through rate (CTR) on the x-axis, average position on the y-axis, click volume as bubble size, and device category as bubble color. Customization options include data control, date range, query, country, and device filters. Analyzing the quadrants formed by average CTR and position helps identify optimization opportunities. Focus on queries with low position but high CTR, and address top-position, low-CTR queries by improving content or structured data.\n"],null,["# How to Create a Search Console Bubble Chart | Google Search Central\n\nImproving SEO with a Search Console bubble chart\n================================================\n\n\nAnalyzing Search performance data is always a challenge, but even more so when you have plenty of\nlong-tail queries, which are harder to visualize and understand. A\n[bubble chart](https://support.google.com/datastudio/answer/7207785)\ncan help you understand which queries are performing well for your site, and which could be improved.\n\n\nIf you'd like to test the techniques discussed here, you can\n[connect your data to Looker Studio](https://datastudio.google.com/reporting/1e5b5f6a-38d7-4547-a54b-69594681a09b/page/xFbeC/preview) and play with the chart settings. \n\n\nIf you haven't read [connecting Search Console to Looker Studio](/search/blog/2022/03/connecting-data-studio) and\n[monitoring Search traffic with Looker Studio](/search/blog/2022/03/monitoring-dashboard),\nconsider checking them out to understand more about what you can do with Search Console in Looker\nStudio.\n\nUnderstanding the chart\n-----------------------\n\n\nA bubble chart is a great visualization when you have multiple metrics and dimensions because it\nlets you to see relationships and patterns in your\ndata more effectively. In the example shown here, you can see\n[click-through rate](https://support.google.com/webmasters/answer/7576553#choosingmetrics)\n(CTR), average position, and clicks for the query and device dimensions in one view.\n\n\nThis section goes into detail on some of the chart elements to clarify what the chart shows, and what it doesn't.\n\n### Data source\n\n\nThe bubble chart shown in this page uses the Site Impression table available through the\n[Search Console data source](https://support.google.com/datastudio/answer/7314895),\nwhich includes [Search performance data](https://support.google.com/webmasters/answer/7576553)\naggregated by site and queries.\n\n### Filters and data controls\n\n\nThere are five customization options in the chart to help you control your data effectively:\n\n1. **[Data control](https://support.google.com/datastudio/answer/7415591)**: Choose the Search Console property you'd like to analyze.\n2. **Date range**: Choose the date range you'd like to see in the report; by default you'll see the last 28 days.\n3. **Query** : Include or exclude queries to focus on. You can [filter your data](/search/blog/2021/06/regex-negative-match) similar to how you do it in Search Console.\n4. **Country**: Include or exclude countries.\n5. **Device**: Include or exclude device categories.\n\n### Axes\n\n\nThe axes in the chart are average position (y-axis) and site CTR (x-axis). There are three\nsignificant transformations in the axes:\n\n6. **Reverse y-axis direction**: Since the y-axis shows average position, inverting it means that 1 is at the top. For most charts, the best position is in the top right corner, so it is more intuitive to invert the y-axis when using it to display average position.\n7. **Log scale** : Using a [logarithmic scale](https://en.wikipedia.org/wiki/Logarithmic_scale) for both axes lets you to have a better understanding of queries that are in the extremities of the chart (very low CTR, average position, or both).\n8. **[Reference lines](https://support.google.com/datastudio/answer/9921462)**: The reference line is very helpful to highlight values that are above or below a certain threshold. Looking at the average, median, or a certain percentile can call attention to deviations from the pattern.\n\n### Bubbles\n\n\nEach bubble in the chart represents a single query, with the following\n[style properties](https://support.google.com/datastudio/answer/7207785#style-properties):\n\n- **Size**: Using the number of clicks as the bubble size helps you see in a glance which queries are driving the bulk of the traffic---the larger the bubble the more traffic the query generates.\n- **Color**: Using the device category as the bubble color helps you understand the differences between mobile and desktop Search performance. You can use any dimension as the color, but as the number of values increases, the harder it is to recognize patterns.\n\nAnalyzing the data\n------------------\n\n\nThe goal of this visualization is to help surface query optimization opportunities. The chart\nshows query performance, where the y-axis represents average position, the x-axis represents CTR\nthe bubble size represents total number of clicks, and the bubble color represents\ndevice category.\n\n\nThe red Average dashed reference lines show the average for each of the axes, which split the chart\ninto quadrants, showing four types of query performance. Your quadrants are likely to look\ndifferent than the one shared in this post; they'll depend on how your site queries\nare distributed.\n\n\nThe chart shows four groups of queries, which you can analyze to help you decide where to invest\nyour time when optimizing your Google Search performance.\n\n1. **Top position, high CTR**: There's not much you need to do for those; you're doing a great job already.\n2. **Low position, high CTR** : Those queries seem relevant to users; the queries get a high CTR even when ranking lower than the average query on your website. If the query average position moves up, it could have a significant impact on your performance---focus on improving SEO for these queries. For example, a top query in quadrant 2 for a gardening website could be \"how to build a wooden shed.\" Check if you have a page about this already, and proceed in two ways:\n - If you don't have a page, consider creating one to centralize all the info you have in the website about the subject.\n - If you do have a page, consider adding content to better address that user need.\n3. **Low position, low CTR** : When looking at queries with low CTR (both with low and top position), it's especially interesting to look at the bubble sizes to understand which queries have a low CTR but are still driving significant traffic. While the queries in this quadrant might seem unworthy of your effort, they can be divided into two main groups:\n - **Related queries**: If the query in question is important to you, it's a good start to have it appearing in Search already. Prioritize these queries over queries that are not appearing in Search results at all, as they'll be easier to optimize.\n - **Unrelated queries**: If your site doesn't cover content related to this query, maybe it's a good opportunity to fine tune your content or focus on queries that will bring relevant traffic.\n4. **Top position, low CTR** : Those queries might have a low CTR for various reasons. Check the largest bubbles to find signs of the following:\n - Your competitors may have [structured data markup](/search/docs/appearance/search-result-features) and are showing up with rich results, which might attract users to click their results instead of yours. Consider optimizing for the most common [visual elements in Google Search](/search/docs/appearance/visual-elements-gallery).\n - You may have optimized, or be \"accidentally\" ranking, for a query that users are not interested in relation to your site. This might not be an issue for you, in which case you can ignore those queries. If you prefer people not to find you through those queries (for example, they contain offensive words), try to fine-tune your content to remove mentions that could be seen as synonyms or related queries to the one bringing traffic.\n - People may have already found the information they needed, for example your company's opening hours, address, or phone number. Check the queries that were used and the URLs that contained the information. If one of your website goals is to drive people to your stores, this is working as intended; if you believe that people should visit your website for extra information, you could try to optimize your titles and description to make that clear. See next section for more details.\n\n\nWe haven't mentioned the device categories because they can be used as additional signs of query\nperformance. For example, suppose some queries are more relevant when people are navigating in the\nstreet, trying to find a location; in that case, the query might have a high performance\non mobile devices, but a low performance on desktop.\n\nImproving SEO for specific queries\n----------------------------------\n\n\nOnce you find queries that are worth the time and effort, make sure to optimize or create pages\nrelated to those queries.\n\n\nAfter you find the queries using the visualization shown in this page, you can\n[create a query filter](https://support.google.com/webmasters/answer/7576553#filteringdata)\nfor specific queries using the Search Console user interface, or create a\n[pivot table](https://support.google.com/looker-studio/answer/7516660)\nusing Looker Studio; in both ways, you can check all the pages that are receiving\ntraffic for a specific query. After you know the queries you want to optimize and their related\nURLs, use the [SEO starter guide](/search/docs/fundamentals/seo-starter-guide)\nto optimize your content. Here are some tips:\n\n- Ensure that your [title](/search/docs/appearance/title-link#page-titles) elements, [description meta tags](/search/docs/appearance/snippet#meta-descriptions), and alt attributes are descriptive, specific, and accurate.\n- Use heading elements to emphasize important text and help create a hierarchical structure for your content, making it easier for users and search engines to navigate through your document.\n- Think about other words that a user might search for to find a piece of your content, for example, synonyms and related queries. You can use the [Keyword Planner](https://ads.google.com/home/tools/keyword-planner/) provided by Google Ads to help you discover new keyword variations and see the approximate search volume for each keyword. You can also [use Google Trends](/search/docs/monitor-debug/google-trends) to find ideas from rising topics and queries related to your website."]]